All published articles of this journal are available on ScienceDirect.

Predicting Ranking Trajectories of EPL Derby Teams

Abstract
Introduction
Research on forecasting league rankings during critical stages of the season, particularly in derby contexts, remains limited.
Methods
This study forecasts league rankings for English Premier League derby teams at mid-season (Round 19) and end-of-season (Round 38) using the NeuralProphet time-series forecasting model and historical ranking data from the 1992–1993 to 2024–2025 seasons.
Results
The results indicate that Liverpool is predicted to finish first in both Round 19 and Round 38, while Manchester City and Arsenal are expected to rank third at both stages. Manchester United is forecasted to show a slight improvement from mid-season to the end of the season, whereas Tottenham Hotspur is predicted to experience a modest decline. Everton is projected to remain near the relegation zone throughout the season.
Discussion
These findings suggest that time-series–based league ranking forecasts can provide valuable practical insights for squad management, tactical planning, and mid- to long-term strategic decision-making.
Conclusion
The study also highlights the potential benefits of advancing ranking prediction research through multivariate time-series methods and staged forecasting frameworks.
1. INTRODUCTION
The Premier League comprises 20 clubs, each playing 38 matches over the course of a season. Match outcomes are classified as wins, draws, or losses, which correspond to the allocation of 3, 1, and 0 points, respectively. League standings are determined by the total points accumulated by each team. At the end of the season, the three lowest-ranked teams are relegated to the second-tier Championship division, while the top four teams qualify for the UEFA Champions League [1]. The team finishing in fifth place qualifies for the UEFA Europa League, and those finishing sixth or seventh may qualify for either the Europa League or the UEFA Europa Conference League, depending on the results of domestic cup competitions [2]. This structure highlights the significant influence of league positioning on the strategic planning and operational decisions of clubs for the following season [3].
Seasonal performance is a critical determinant of qualification for European competitions [4]. League results significantly influence squad composition and preparation for the following season [5]. Consequently, understanding seasonal performance is essential for clubs when developing strategies and long-term plans for subsequent seasons [6].
Within the Premier League, competition is also defined by long-established rivalries between clubs, particularly derby matches. A derby match typically refers to a contest between clubs based in the same city or region [7]. Representative examples include the Manchester Derby between Manchester United and Manchester City, which reflects intra-regional competition among local fan bases [8]; the Merseyside Derby between Liverpool FC and Everton FC [9], widely regarded as one of the most intense rivalries in football; the North London Derby between Arsenal and Tottenham Hotspur, characterized by a long history of fluctuating dominance that has intensified regional rivalry [10]; and the Northwest Derby between Manchester United and Liverpool FC, where inter-city competition has evolved into one of football’s most prominent rivalries [11].
Derby matches often exhibit heightened intensity due to their association with local identity and collective behavior [12]. In major cities such as London, Manchester, and Liverpool, long-standing histories and deeply entrenched rivalries generate high levels of engagement among both players and fans [13]. Furthermore, derby results can affect players’ confidence and overall league performance, potentially prompting adjustments in managerial tactics and broader club strategies [14]. These characteristics make derby matches a particularly meaningful context for examining league ranking dynamics through predictive analysis.
Unlike most major European leagues that implement a mid-season break from Christmas to early January, the Premier League continues competition throughout the festive period, beginning on Boxing Day [15]. The congested fixture schedule increases the risk of injury and heightens the importance of strategic match management [16]. For instance, Chelsea FC’s performance during the 2014–2015 Boxing Day fixtures played a critical role in its championship success [17]. These cases illustrate that mid-season rankings can be as influential as end-of-season standings. Although previous studies have attempted to predict match outcomes or season rankings in football [18-20], limited attention has been given to forecasting rankings specifically related to derby rivalries or mid-season league standings.
This study addresses this gap by conducting a time-series forecasting analysis of league rankings in the world’s most widely viewed football league. It focuses on clubs involved in the Manchester Derby, Merseyside Derby, North London Derby, and Northwest Derby-namely Manchester United, Manchester City, Liverpool FC, Everton FC, Tottenham Hotspur, and Arsenal FC-by predicting their rankings at the midpoint of the season (Round 19, immediately following the Boxing Day period) and at the end of the season (Round 38). Through this approach, the study aims to extend football forecasting research from predominantly match-level prediction toward the temporal forecasting of league-ranking trajectories and to examine the expected competitive positions of major EPL rivals at different stages of the season.
2. MATERIALS AND METHODS
2.1. Study Design
The present study employed a time-series forecasting framework using the NeuralProphet model to predict future league standings in the English Premier League (EPL). Time-series forecasting is an analytical approach that estimates future outcomes based on chronologically ordered observations and has been widely applied across disciplines such as economics, healthcare, media studies, and the natural sciences [21]. Earlier forecasting studies primarily relied on statistical methods, including ARIMA and SARIMA models [22]. However, these traditional techniques are limited by assumptions of linearity, reducing their effectiveness in handling the nonlinear and highly dynamic characteristics of modern datasets [23].
To address these methodological limitations, recent forecasting research has increasingly incorporated deep learning architectures capable of modeling nonlinear sequential patterns, such as Long Short-Term Memory (LSTM) networks and NeuralProphet [24]. NeuralProphet, developed by Facebook’s Data Science team, extends the traditional Prophet framework by incorporating neural network architectures, enabling improved modeling of nonlinear, nonstationary, and complex temporal patterns. It has demonstrated forecasting improvements ranging from 55% to 92% over Prophet in short- and medium-term prediction scenarios [25].
NeuralProphet preserves interpretable time-series components, such as trend and seasonality, while integrating neural network-based elements that enable flexible modeling of temporal patterns [25]. These features are particularly relevant to EPL rankings, which consist of sequential observations that evolve across seasons and form long-term ranking trajectories. Consequently, NeuralProphet was chosen to capture temporal changes in historical league positions and to extend these patterns for forecasting future rankings.
Within the field of sports analytics, NeuralProphet forecasting has been employed to predict team rankings in the English Premier League [26]. Meanwhile, Lee and Chung [27] applied NeuralProphet to predict lap times in Formula 1, demonstrating the model's robustness for sports-related forecasting tasks. Additionally, Lee et al. [28] used NeuralProphet to estimate attendance patterns in the KBO League, further supporting the model's applicability for short-term predictive analyses in sports contexts.
Based on these methodological considerations, this study employed the NeuralProphet framework to forecast EPL derby team rankings using historical league data from the 1992–1993 through 2024–2025 seasons. The analysis specifically focused on clubs involved in four prominent rivalries-the Manchester Derby, Merseyside Derby, North London Derby, and Northwest Derby-including Manchester United, Manchester City, Liverpool, Everton, Tottenham Hotspur, and Arsenal. Forecasts were generated for two key competitive stages: the post-Boxing Day midpoint of the season (Round 19) and the final league standings at the end of the season (Round 38).
2.2. Configuration and Training of the NeuralProphet Model
The same NeuralProphet modeling procedure and parameter configuration were consistently applied to the historical ranking data of all teams included in the analysis. The analysis was conducted using Python 3.10 and NeuralProphet version 0.9.0. The historical league ranking was specified as the target variable, and all available ranking observations up to and including the 2024–2025 season were used for model fitting. No separate training, validation, or test data splits were applied.
The NeuralProphet model was configured to capture the temporal structure of the EPL ranking data. The rankings were modeled at six-month intervals (`freq='6M'`). Yearly seasonality was enabled to account for recurring annual patterns, while weekly and daily seasonalities were disabled because the ranking data were not structured at weekly or daily intervals. The seasonality component was specified using a multiplicative mode. The learning rate was set to 0.01, and these parameter settings were applied consistently across all team datasets.
Following model fitting, historical fitted values were generated for the observed period. These fitted values were then compared with the corresponding observed rankings to assess the degree of historical model fit. The fitted models were subsequently used to forecast the next two observation points, corresponding to Rounds 19 and 38 of the 2025–2026 season. Since NeuralProphet produces continuous numerical estimates, both the original estimates and their rounded integer values were used in the evaluation.
2.3. Data Collection
To forecast league rankings, data on team positions from Rounds 19 and 38 of each season between 1992–1993 and 2024–2025 were collected from the official Premier League website (https://www.premierleague.com/ en/). The dataset comprises 33 seasons with two observations per season, resulting in a total of 66 ranking observations per team. NeuralProphet has been applied in previous research using time-series datasets of a similar scale. For example, Lee and Chung [29] applied NeuralProphet to 72 quarterly observations to forecast financial indicators of K League citizen football clubs. Similarly, the present study utilized 66 ranking observations per team, representing the complete historical period of the Premier League from its inaugural 1992–1993 season through the 2024–2025 season.
Manchester United, Liverpool, Everton, Arsenal, and Tottenham Hotspur have not been relegated since the Premier League's inception in the 1992–1993 season; therefore, no missing values occurred for these five clubs during data collection. In contrast, Manchester City was relegated to lower divisions during the 1996–1997 to 1999–2000 seasons and again in the 2001–2002 season. For these relegated seasons, Manchester City’s league position was adjusted to 20th place to maintain continuity in the time-series data.
2.4. Model Performance Evaluation
To assess forecasting performance, this study employed two commonly used error metrics: MAE (Mean Absolute Error) and RMSE (Root Mean Squared Error), as presented in Table 1. These metrics are widely utilized to evaluate the accuracy of predictive models in time-series research [30]. MAE quantifies the average magnitude of prediction errors regardless of their direction, while RMSE calculates the square root of the mean of squared prediction errors, thereby assigning greater weight to larger deviations [31]. Lower MAE and RMSE values indicate smaller discrepancies between estimated and observed values, with values closer to zero representing lower forecasting errors [32].
Table 1.
| Category | MAE | References | ||
|---|---|---|---|---|
| Actual Value (Continuous) | Rounded Value (Integer) | Actual Value (Continuous) | Rounded Value (Integer) | |
| Manchester United | 1.414 | 1.394 | 2.094 | 2.060 |
| Manchester City | 1.794 | 1.788 | 2.521 | 2.486 |
| Liverpool | 1.813 | 1.848 | 2.296 | 2.348 |
| Everton | 2.777 | 2.742 | 3.475 | 3.466 |
| Arsenal | 1.782 | 1.727 | 2.392 | 2.374 |
| Tottenham | 2.38 | 2.318 | 3.178 | 3.184 |
In this study, MAE and RMSE were calculated by comparing the historical ranking estimates generated by NeuralProphet with the corresponding observed league rankings at the same time points. Since NeuralProphet produces continuous numerical estimates, whereas EPL rankings are expressed as discrete integer positions, the error metrics were computed for both the original continuous estimates and the values rounded to the nearest integer. Thus, the reported MAE and RMSE values represent the discrepancies between the model-estimated and observed rankings within the historical data used in the analysis. Specifically, MAE indicates the average number of ranking positions by which the estimated rankings differ from the observed rankings, while RMSE reflects the magnitude of these discrepancies with greater sensitivity to larger ranking errors. Accordingly, smaller MAE and RMSE values indicate that the model-generated historical estimates were closer to the actual league rankings.
2.5. Forecasting League Rankings
The NeuralProphet model was used to forecast league rankings for the 2025–2026 season at two time points: Round 19 and Round 38. The model generated predictions as continuous real-valued outputs; however, because actual league rankings are represented as discrete natural numbers, the predicted values were rounded to the nearest integer. Accordingly, ranking outcomes were reported by distinguishing between the original continuous predictions and their rounded integer counterparts to ensure consistency with the league’s ranking system.
3. RESULTS
3.1. Manchester United
Figures 1 and 2, along with Table 2, present the predicted league standings for Manchester United in the 2025–2026 season. The team was predicted to be in 8th place at Round 19 and to improve to 7th place by Round 38, indicating a positive change in their league position during the latter half of the season.
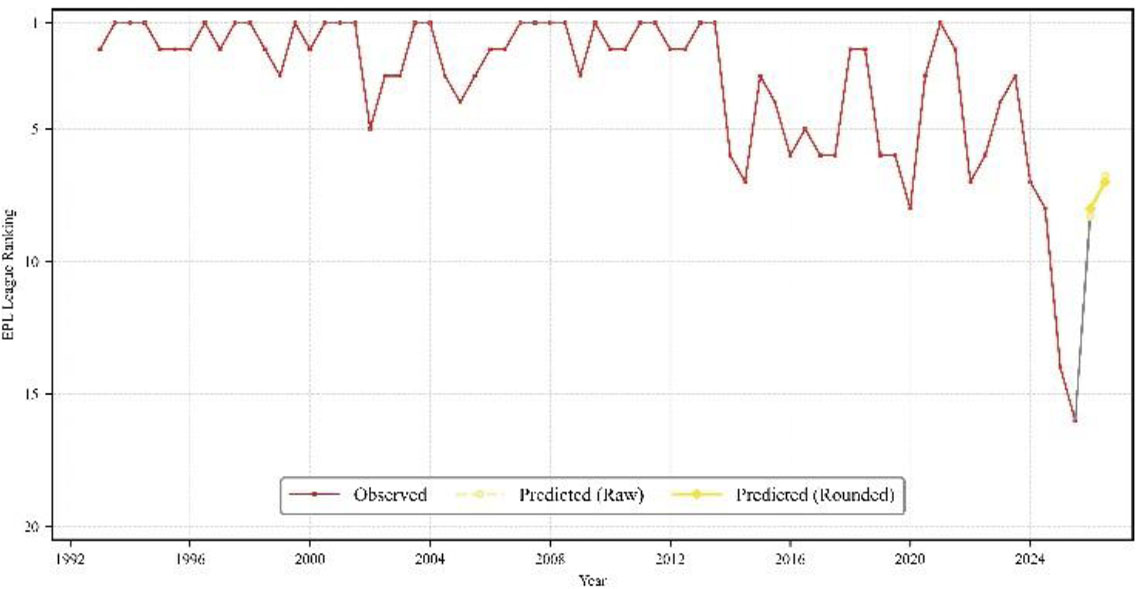
Historical and forecasted EPL rankings for Manchester United.
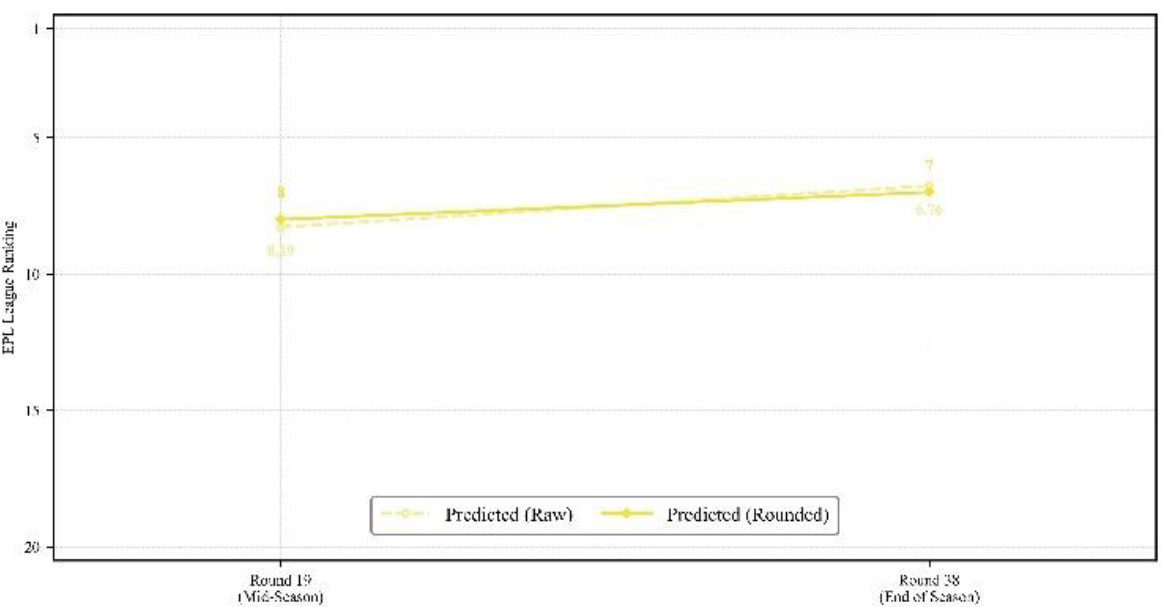
Detailed forecast of EPL rankings for Manchester United.
| Round | Actual Value (Continuous) | Rounded Value (Integer) |
|---|---|---|
| 19R | 8.286336 | 8 |
| 38R | 6.761899 | 7 |
3.2. Manchester City
Figures 3 and 4, along with Table 3, present the predicted league standings for Manchester City in the 2025–2026 season. The team is predicted to finish in third place at both Round 19 and Round 38.
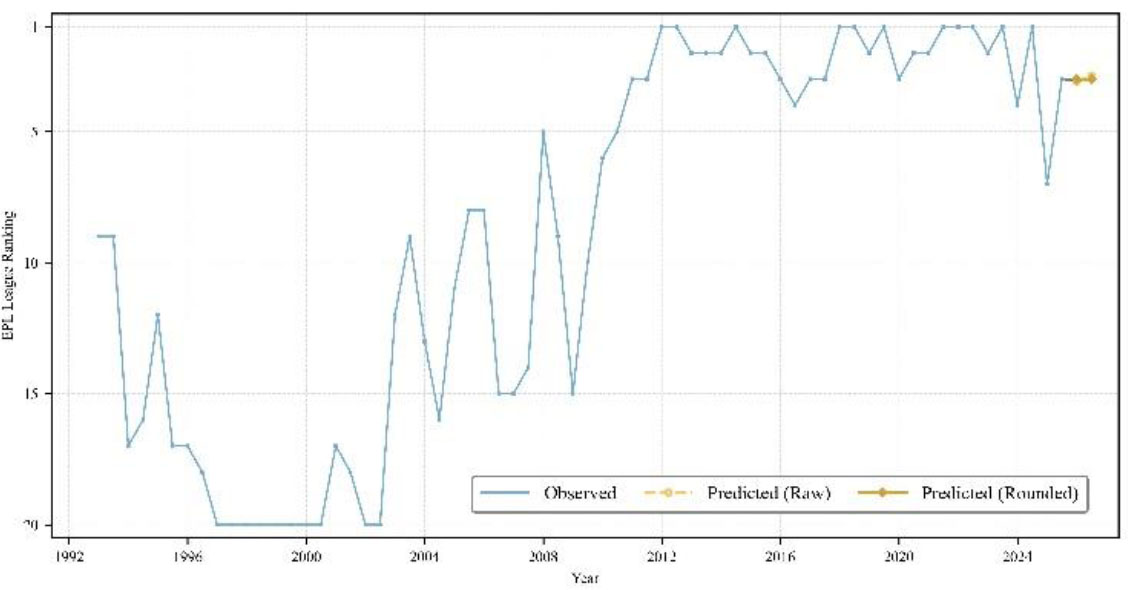
Historical and forecasted EPL rankings for Manchester city.
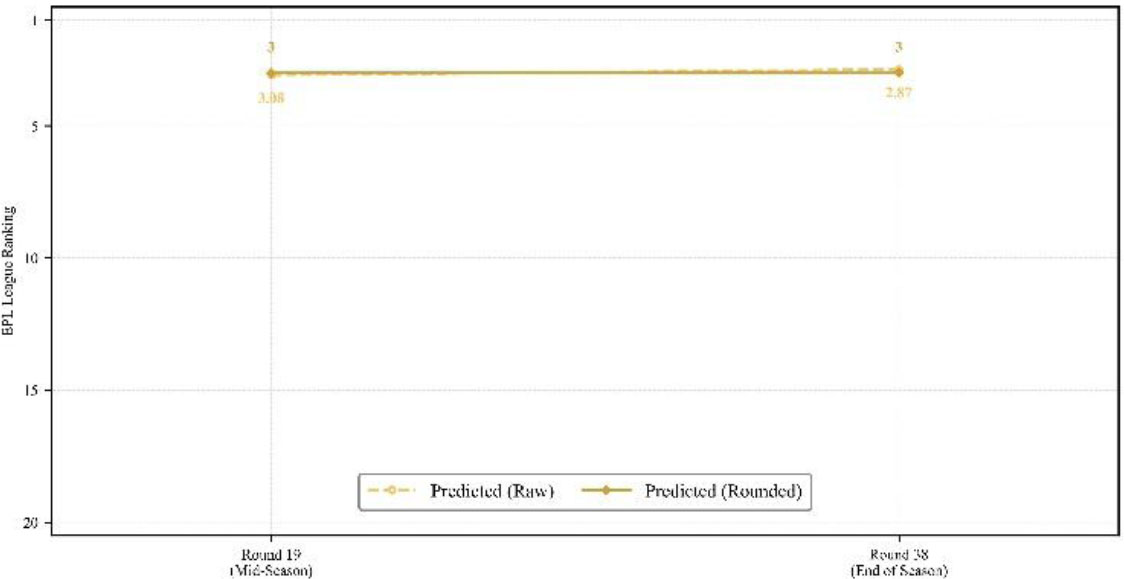
Detailed forecast of EPL rankings for Manchester city.
| Round | Actual Value (Continuous) | Rounded Value (Integer) |
|---|---|---|
| 19R | 3.080883 | 3 |
| 38R | 2.867812 | 3 |
3.3. Liverpool
Figures 5 and 6, along with Table 4, present the predicted league standings for Liverpool in the 2025–2026 season. The team is predicted to finish in first place at both Round 19 and Round 38.
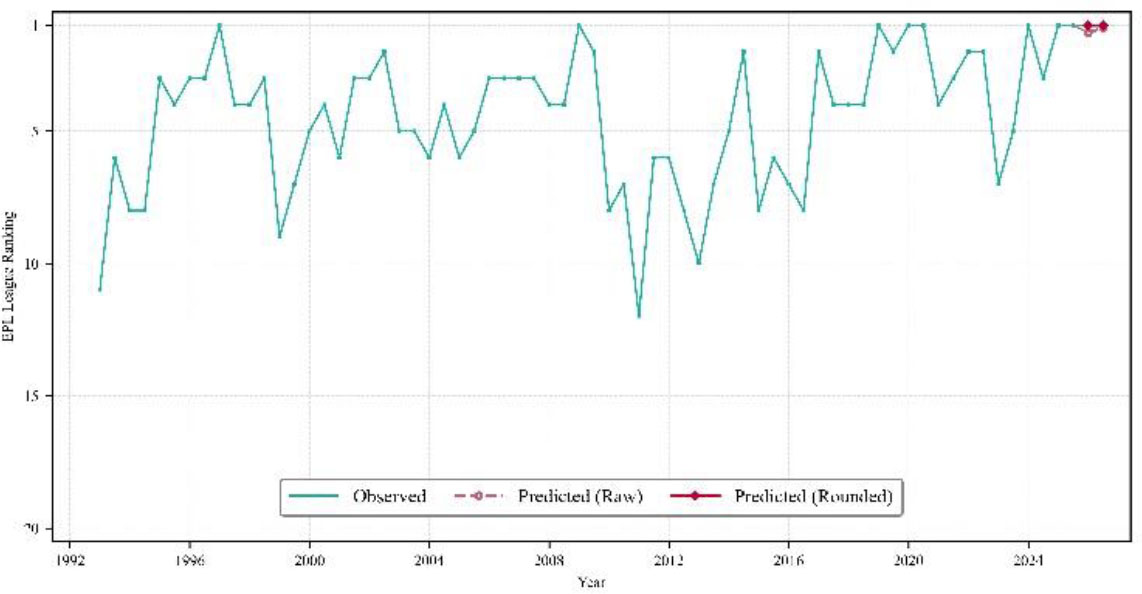
Historical and forecasted EPL rankings for Liverpool.
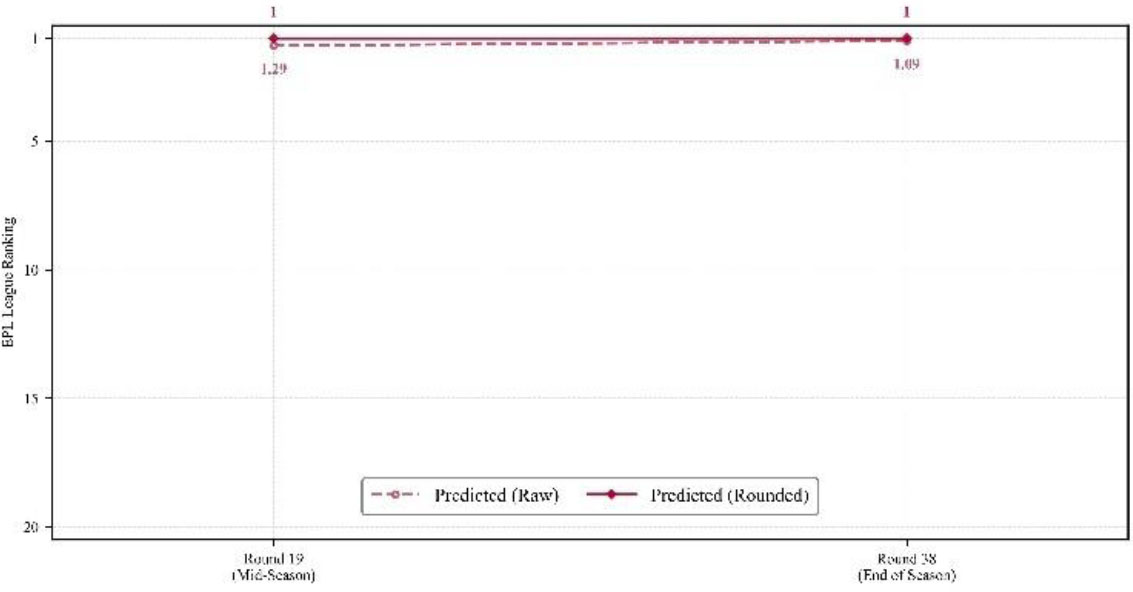
Detailed forecast of EPL rankings for Liverpool.
| Round | Actual Value (Continuous) | Rounded Value (Integer) |
|---|---|---|
| 19R | 1.285766 | 1 |
| 38R | 1.091420 | 1 |
3.4. Everton
Figures 7 and 8, along with Table 5, present the predicted league standings for Everton in the 2025–2026 season. The team is predicted to finish in 17th place at both Round 19 and Round 38.
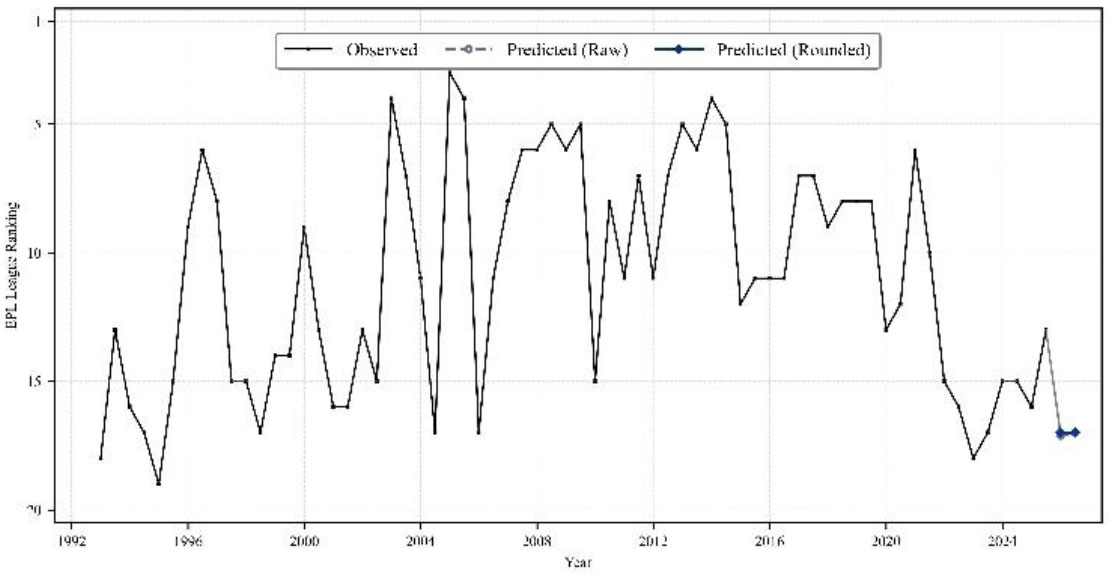
Historical and forecasted EPL rankings for Everton.
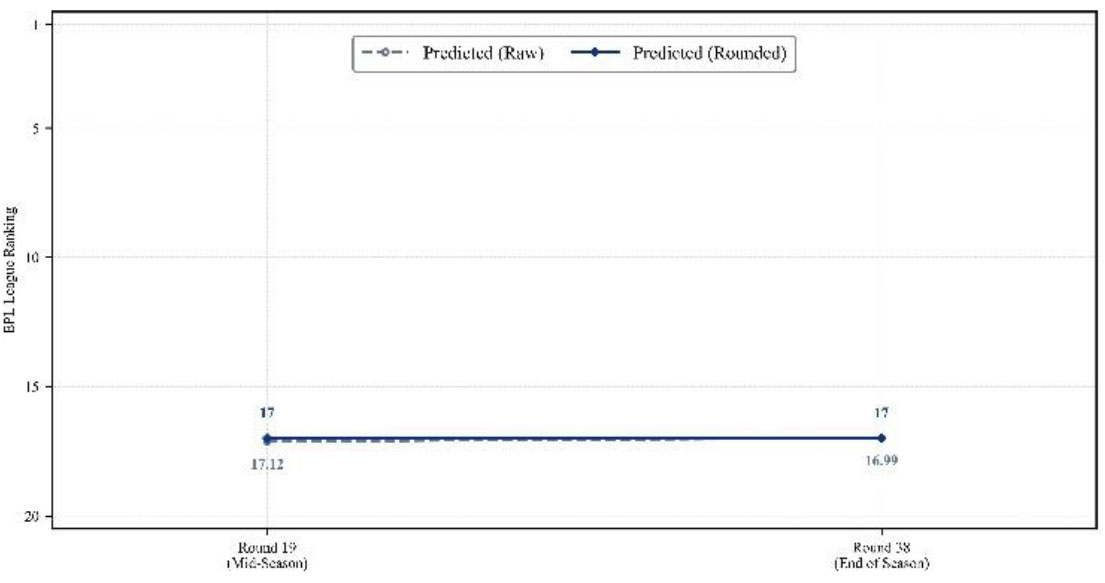
Detailed forecast of EPL rankings for Everton.
| Round | Actual Value (Continuous) | Rounded Value (Integer) |
|---|---|---|
| 19R | 17.121111 | 17 |
| 38R | 16.987461 | 17 |
3.5. Arsenal
Figures 9 and 10, along with Table 6, present the predicted league standings for Arsenal in the 2025–2026 season. The team is predicted to finish in third place at both Round 19 and Round 38.
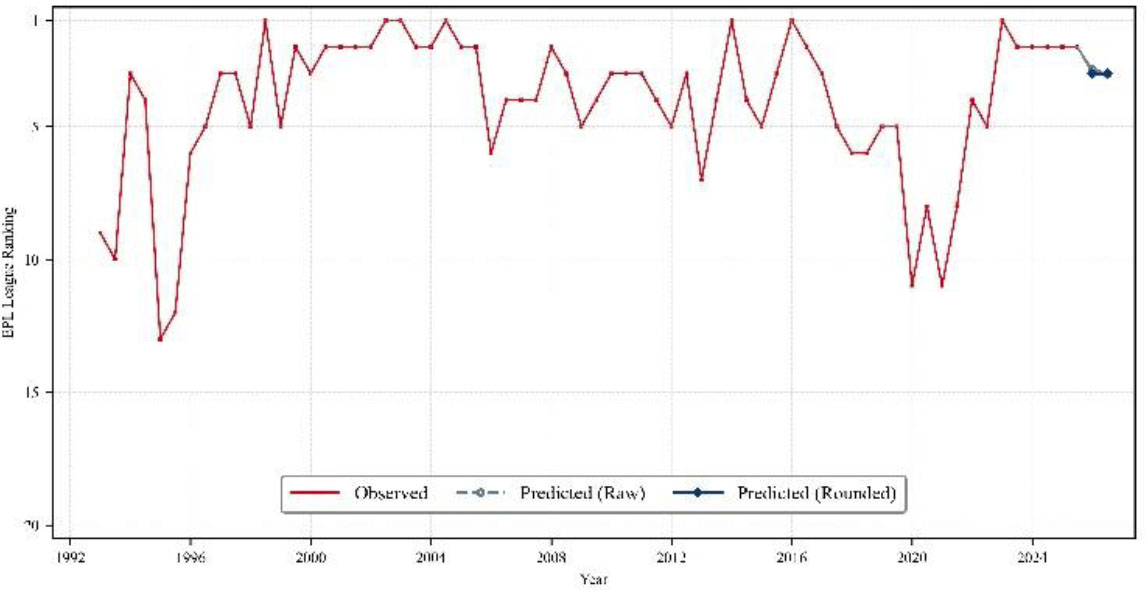
Historical and forecasted EPL rankings for Arsenal.
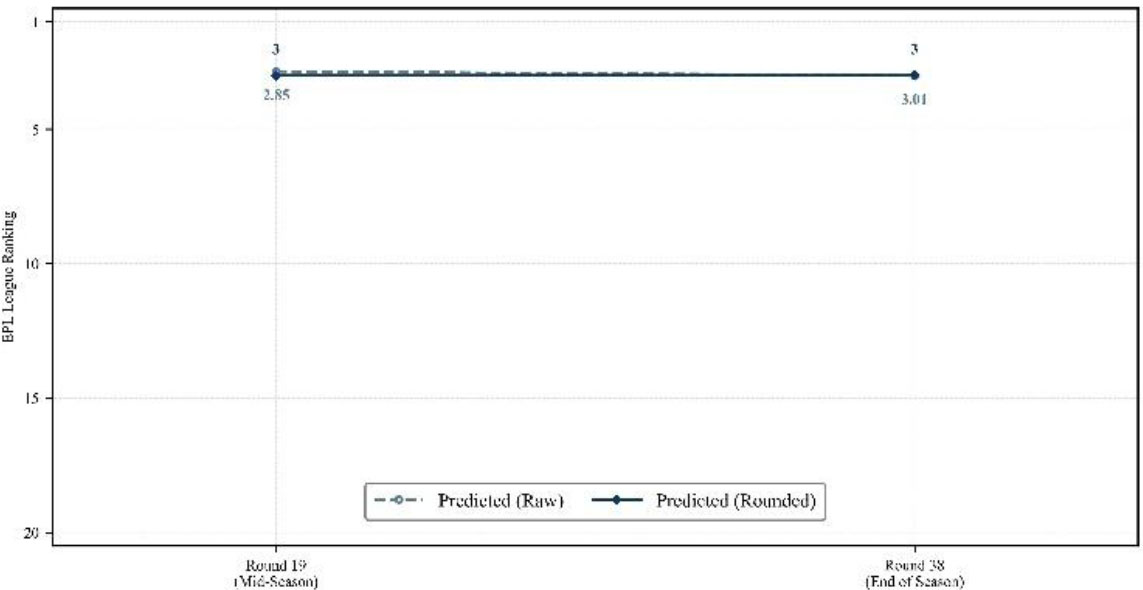
Detailed forecast of EPL rankings for Arsenal.
| Round | Actual Value (Continuous) | Rounded Value (Integer) |
|---|---|---|
| 19R | 2.847373 | 3 |
| 38R | 3.008644 | 3 |
3.6. Tottenham
Figures 11 and 12, along with Table 7, present the predicted league standings for Tottenham Hotspur in the 2025–2026 season. The team is predicted to be in 8th place at Round 19, dropping to 9th place by Round 38, indicating a decline in league position during the latter half of the season.
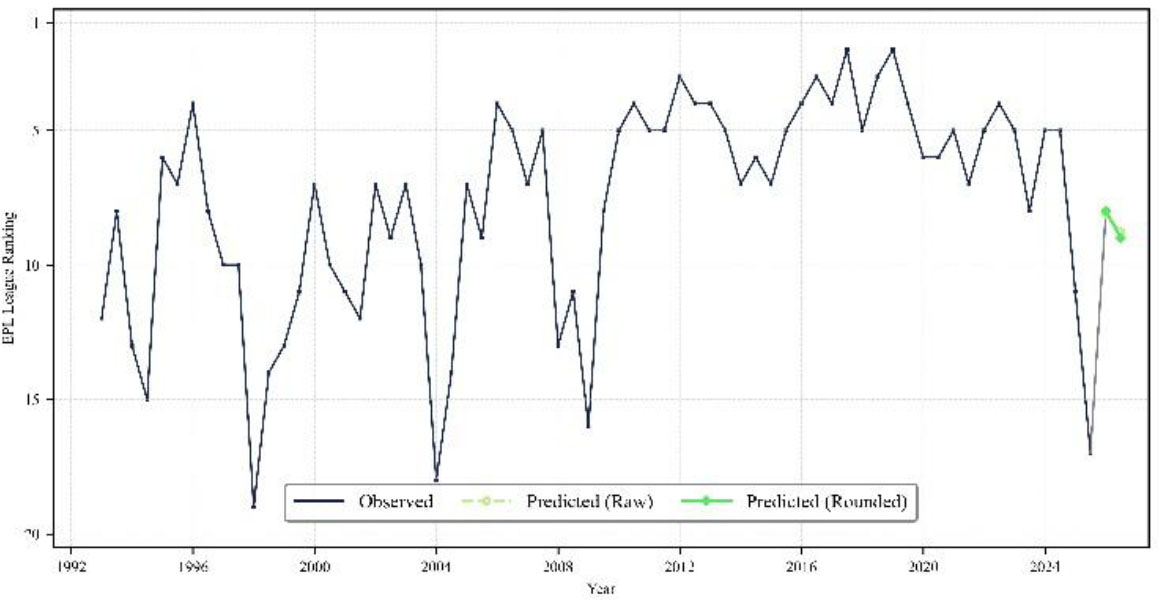
Historical and forecasted EPL rankings for Tottenham Hotspur.
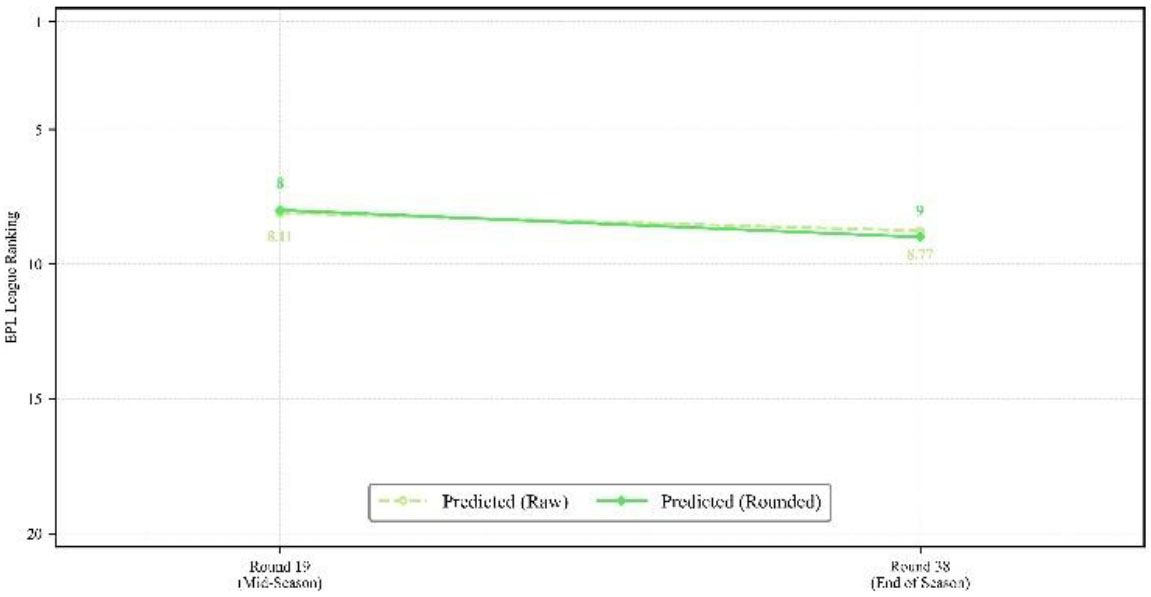
Detailed forecast of EPL rankings for Tottenham Hotspur.
| Round | Actual Value (Continuous) | Rounded Value (Integer) |
|---|---|---|
| 19R | 8.105234 | 8 |
| 38R | 8.765211 | 9 |
4. DISCUSSION
The present study applied NeuralProphet to historical EPL ranking data to forecast the positions of six clubs involved in major EPL derbies at Rounds 19 and 38. The results indicated relatively minor changes between the two forecast points. Liverpool was predicted to rank first at both Round 19 and Round 38, while Manchester City and Arsenal were forecasted to remain in third place, and Everton in 17th place. Manchester United was expected to improve from eighth to seventh place, whereas Tottenham Hotspur was predicted to decline from eighth to ninth place. Overall, four of the six teams maintained the same rounded ranking between the two forecast points, while the remaining two showed a one-position change.
The predicted ranking patterns can be understood in relation to the characteristics of NeuralProphet and the temporal structure of the data used in this study. NeuralProphet models chronologically ordered observations by representing temporal components such as trend and seasonality. In this study, the historical rankings of each team were arranged sequentially across seasons, and future rankings were estimated based on the temporal patterns identified in these historical observations. The relatively small differences between Round 19 and Round 38 indicate that the temporal patterns extracted from the historical ranking data resulted in largely continuous trajectories across the two forecast points. However, the continuous forecast values exhibited changes even when the rounded league positions remained unchanged. For example, Manchester City’s predicted ranking changed from 3.08 at Round 19 to 2.86 at Round 38, whereas Arsenal’s changed from 2.85 to 3.00. This demonstrates that the continuous estimates can capture subtle temporal variations in the predicted trajectory that are not apparent when the forecasts are converted into integer league positions.
The one-position changes observed for Manchester United and Tottenham Hotspur further illustrate differences in the ranking trajectories derived from historical data. Manchester United exhibited an upward trajectory, moving from eighth to seventh place, whereas Tottenham experienced a downward trajectory, dropping from eighth to ninth place. In contrast, Liverpool and Everton maintained consistent predicted positions across both forecast points. These patterns indicate that the model generated varying directions and magnitudes of temporal change based on each team’s historical ranking series. Therefore, the findings are more appropriately interpreted in terms of the continuity and change in predicted ranking trajectories rather than as indicators of specific changes in team performance or club management.
From a methodological standpoint, this study differs from conventional football forecasting approaches that primarily focus on predicting individual match outcomes or specific performance indicators. Instead of treating each match as an independent prediction target, this study considers league rankings as a longitudinal time-series variable and examines their progression between the mid-season and the end of a future season. This approach allows football forecasting to be viewed from a season-level temporal perspective by emphasizing changes in a team’s relative competitive position over time. Consequently, the academic significance of this study lies in extending the application of time-series forecasting from individual outcomes to longitudinal league-ranking trajectories and demonstrating the applicability of NeuralProphet for analyzing temporal changes in EPL standings.
5. LIMITATION
This study has several limitations. First, the forecasting model used league ranking as the sole time-series variable and did not incorporate other performance-related and contextual factors that may influence league standings. EPL rankings are determined by multiple interacting factors, including points, goal difference, goals scored and conceded, player injuries and availability, transfers, managerial changes, and fixture congestion. The exclusion of these variables limits the ability of the forecasts to capture the complex dynamics underlying changes in league position. Future research should develop multivariate forecasting frameworks that incorporate relevant performance and contextual variables to provide a more comprehensive representation of ranking dynamics.
Second, this study did not explicitly model the temporal dependency between mid-season and end-of-season rankings. Although Round 19 and Round 38 were forecasted as two sequential time points, the predicted Round 19 ranking was not used as a conditioning variable for the Round 38 forecast. Therefore, the model did not directly estimate how a team's mid-season position influences its subsequent ranking progression. Future research could address this limitation by developing a staged forecasting framework that incorporates mid-season rankings and related performance data into the prediction of end-of-season standings.
Third, this study focused on applying NeuralProphet to forecast EPL ranking trajectories and did not aim to compare the relative performance of different forecasting algorithms. Future research could extend these findings by comparing NeuralProphet with alternative forecasting methods, such as ARIMA, Prophet, and LSTM, under identical data conditions. Such comparative analyses would provide valuable insights into the relative strengths and predictive characteristics of various forecasting approaches for league ranking data and contribute to the development of more robust forecasting frameworks in sports analytics.
CONCLUSION
This study applied NeuralProphet to historical EPL ranking data to forecast the positions of selected teams at Rounds 19 and 38 of the 2025–2026 season. The results indicated that the predicted rankings generally aligned with each team's historical ranking patterns, although the magnitude and direction of ranking changes varied among teams. These findings demonstrate the applicability of NeuralProphet to longitudinal professional football ranking data and offer a quantitative method for examining potential shifts in team ranking trajectories. From a practical standpoint, the predicted rankings can serve as supplementary information for monitoring potential changes in team positions and understanding their ranking trajectories throughout the season. The forecasting approach employed in this study can also be applied to other professional football leagues, offering a quantitative framework for analyzing and predicting league ranking trajectories across diverse competitive environments.
AUTHORS’ CONTRIBUTIONS
The authors confirm their contributions to the paper as follows: J.Y.C. and D.I.L.: Study conception and design; J.Y.C.: Data collection, Draft manuscript, Methodology; D.I.L.: Conceptualization. All authors reviewed the results and approved the final version of the manuscript.
LIST OF ABBREVIATIONS
| UEFA | = Union of European Football Associations |
| EPL | = English Premier League |
| ARIMA | = Autoregressive Integrated Moving Average |
| SARIMA | = Seasonal Autoregressive Integrated Moving Average |
| LSTM | = Long Short-Term Memory |
| MAE | = Mean Absolute Error |
| RMSE | = Root Mean Squared Error |
ETHICS APPROVAL AND CONSENT TO PARTICIPATE
This study employed a time-series research design utilizing publicly available secondary data obtained from official websites. Since the study did not involve human participants, direct interaction, or identifiable personal information, it did not require Ethics/IRB approval.
AVAILABILITY OF DATA AND MATERIALS
The dataset generated and analyzed during the current study is publicly available from the official Premier League website(https://www.premierleague.com/en/).
ACKNOWLEDGEMENTS
It was a challenging academic journey, but I am truly grateful and happy that we completed it together.