All published articles of this journal are available on ScienceDirect.

Performance Factors of Foreign Players Contributing to Team Success in Korean Women’s Volleyball

Abstract
Introduction
Research on predicting detailed offensive performance indicators in volleyball remains limited. This study empirically analyzed the impact of foreign female volleyball players on team offensive performance and explored the potential for developing data-driven volleyball strategies.
Methods
Using data from the 2015–2016 to 2024–2025 seasons, the NeuralProphet time-series model was employed to predict offensive performance indicators at both the team and foreign player levels.
Results
Top-ranking teams achieved an attack efficiency ranging from 27.084% to 32.959% and averaged 2.413 to 3.081 blocks per set. In contrast, bottom-ranking teams recorded an attack efficiency of 22.357% to 26.025% and averaged 1.705 to 2.642 blocks per set, all of which were lower overall than those of the top-ranking teams. Foreign players in top-ranking teams had predicted values of 26.181% to 38.163% for attack efficiency, 20.396% to 28.762% for attack share, and 0.279 to 0.789 average blocks per set. Foreign players in bottom-ranking teams showed predicted values of 22.281% to 28.699% for attack efficiency, 23.216% to 33.694% for attack share, and 0.148 to 0.438 average blocks per set.
Discussion
Except for the attack share rate, these values were generally higher in top-ranking teams than in bottom-ranking teams. This pattern suggests that offensive efficiency and blocking performance, rather than the proportion of attack share alone, are more strongly associated with higher team rankings.
Conclusion
Professional volleyball clubs can utilize time-series-based predictive information to develop data-driven tactical designs and training feedback systems.
1. INTRODUCTION
Among Korean professional sports, volleyball and basketball have both men's and women's professional leagues that attract substantial public interest [1]. Notably, women's volleyball has continued to gain popularity due to its consistent international achievements, including a fourth-place finish at the 2012 London Olympics, as well as its relatively higher fan engagement compared to men's volleyball [2].
To enhance player competitiveness on the global stage and promote the overall development of the V-League, a foreign player system was introduced in 2006. Given that volleyball match outcomes heavily depend on offensive performance [3], V-League clubs have prioritized recruiting foreign players with superior offensive skills. These players have subsequently become central figures who significantly influence the flow and outcomes of games. Consequently, when a top-ranking team’s foreign player was sidelined due to injury, the team’s ranking often dropped sharply, underscoring the strong correlation between foreign player performance and overall team success [4].
Accordingly, comparing top-ranking and bottom-ranking teams may provide valuable insights into whether differences in foreign players' offensive performance are associated with variations in team success. Since these two groups represent opposite ends of the competitive spectrum, this approach enables the identification of performance patterns that distinguish more successful teams from less successful ones.
A growing body of empirical research has consistently demonstrated that foreign players significantly influence team performance outcomes across professional sports, including basketball [5]. Additionally, Panagiotis et al. [6] showed that foreign players’ abilities not only enhance team performance but also contribute to the overall development of team competency, further underscoring the strategic importance of international player recruitment.
Foreign players play a crucial role in enhancing the technical and tactical quality of volleyball competition. They introduce diverse playing tempos, rally speeds, and hybrid attacks, such as quick combinations, back attacks, and varied toss rhythms, that contribute to the technical development of domestic athletes [7]. When a foreign player occupies a high-scoring position, such as opposite or outside hitter, the setter’s toss distribution often reorganizes around that player, prompting tactical adjustments within the team [8]. Given the significant influence of foreign players on team performance and tactical dynamics, empirical research examining the relationship between foreign player performance and team success is essential to inform strategic recruitment decisions.
Volleyball, as a team sport, is characterized by the critical role of offensive performance in determining match outcomes [9]. Consequently, professional clubs often strengthen their rosters by recruiting foreign players who specialize in offensive positions [10]. Developing training plans and implementing new tactical systems based on detailed performance indicators play decisive roles in influencing match results [11]. Accordingly, numerous studies have analyzed specific performance metrics in volleyball. In terms of offensive indicators, prior research has examined attack success rate, ball angular velocity, and setter–attacker coordination efficiency [12]. Regarding defensive indicators, scholars have investigated serve-reception accuracy, digging success rate, and defensive reaction time [13]. At the team level, studies have explored rally-based expected points, transition attack success rate, and rotation efficiency [14]. However, most of these studies have focused on post-match performance analysis rather than predictive modeling of future performance indicators. Foreign players have been reported to play a significant role in offensive productivity and competitive performance within professional volleyball teams [15]. Therefore, attack efficiency rate, attack share rate, and average number of blocks per set are key indicators for evaluating the contributions of foreign players.
Against this background, although recent volleyball studies have examined match outcome prediction [16, 17] and performance analysis [18, 19], research on forecasting detailed offensive performance indicators remains limited. Therefore, the present study aims to identify the key offensive indicators of top-ranking and bottom-ranking teams in the Women’s Professional Volleyball League (KOVO). The findings are expected to provide practical insights into foreign player recruitment strategies, tactical optimization, and data-driven team management in professional volleyball. Furthermore, by introducing predictive analytics into a domain where such approaches have been underexplored, this study will contribute to the academic advancement of time-series forecasting applications in sports performance analysis.
2. METHODS
2.1. Study Design
This study employed a time-series forecasting approach using the NeuralProphet model to identify performance trends and assess the relationship between foreign players’ offensive performance indicators and team ranking patterns. Time-series analysis is a predictive method that utilizes data collected over time to forecast future trends and has been widely applied across various fields, including medicine, economics, media, and the natural sciences [20].
Traditionally, classical forecasting models such as ARIMA and SARIMA have been widely used for time-series prediction [21]. However, these models are primarily designed to capture linear relationships and often exhibit reduced forecasting accuracy when applied to increasingly nonlinear and volatile datasets [22]. Consequently, machine learning and deep learning approaches, including LSTM, Transformer-based architectures, and NeuralProphet, have gained considerable attention due to their ability to model complex temporal dynamics [23]. Among these methods, NeuralProphet is particularly suitable for the present study because it combines the interpretability of the Prophet framework with the forecasting capabilities of neural networks. Specifically, NeuralProphet can explicitly model trend and seasonality while effectively accommodating nonlinear temporal variations, making it well-suited for sports performance data. As an extension of the original Prophet framework developed by Facebook's Data Science team, NeuralProphet incorporates neural network components to enhance its ability to model complex, nonlinear, and nonstationary patterns. Empirical studies have demonstrated that NeuralProphet achieves 55–92% higher forecasting accuracy than Prophet in short- and medium-term predictions [24].
Building on these methodological advances, the present study applied the NeuralProphet model to analyze and forecast offensive performance indicators in the Women’s Professional Volleyball League (KOVO) from the 2015–2016 to 2024–2025 seasons. Specifically, the model predicts one-year-ahead values for team-level indicators, attack efficiency rate and average number of blocks per set, as well as foreign-player-specific indicators, including attack efficiency rate, attack share rate, and average number of blocks per set.
2.2. NeuralProphet Model Configuration and Training
This study reconstructed all collected weekly data to reflect the structural characteristics of the Women’s Professional Volleyball League (KOVO), which operates during distinct seasonal and off-season periods and holds matches at least once a week. Before model training, all date variables were converted to the datetime format required by NeuralProphet, and records containing missing values or invalid observations were excluded from the analysis. Since the league begins and ends at approximately the same time each year, yearly seasonality was enabled to capture annual cyclical fluctuations. In contrast, weekly and daily seasonalities were disabled because match schedules do not follow a fixed weekday pattern and are not organized on a daily basis.
Since the variation in each indicator does not exhibit a consistent periodic pattern but instead fluctuates based on match conditions and team strength, the seasonality_mode was set to “multiplicative” to capture proportional rather than absolute changes in the seasonal components. This configuration reflects the nature of volleyball performance, where relative variations are more meaningful than absolute values.
The learning rate was fixed at 0.01 to prevent potential overfitting and to ensure the model's generalization capability, thereby reducing prediction bias that could arise from the limited number of matches per season. The NeuralProphet model was trained using the complete historical dataset (2015–2016 to 2024–2025) to maximize the utilization of available temporal information for forecasting the subsequent 36 weeks. Additionally, to prevent temporal leakage, all input variables were constructed using only information available prior to the target prediction point. Consequently, future observations were excluded from the training process, preserving the temporal order of the data and minimizing contamination from future information. All analyses were conducted using Python (version 3.10) with NeuralProphet (version 0.9.0). All other model parameters were maintained at their default settings.
2.3. Data Collection
To forecast offensive indicators for the upcoming season of the Women’s Professional Volleyball League (KOVO), this study collected match statistics from the KOVO DB BANK spanning the 2015-2016 through 2024-2025 seasons.
Among the many offensive metrics used in volleyball, such as total points, attack attempts, open attacks, serves, blocks, and spikes, the present study focused on three key offensive indicators: attack efficiency rate, attack share rate, and average number of blocks per set.
Traditional performance indicators often emphasize the number of successful attacks; however, these measures do not fully capture offensive effectiveness because they exclude failed attempts, such as attack errors and blocked shots [25]. To address this limitation, Shondell and Reynaud [26] proposed the attack efficiency metric, which subtracts attack errors and blocked attempts from successful attacks and then divides the result by the total number of attack attempts. This index allows for a more comprehensive evaluation of offensive performance at both the player and team levels [27].
The attack share rate represents the proportion of total team attack attempts by a specific player [28]. This metric provides a quantitative assessment of players’ levels of offensive involvement and tactical importance within the team structure [29]. Similarly, the average number of blocks per set measures the ratio of successful blocks to the total number of sets played, thereby reflecting a team’s tactical deployment and strategic efficiency [30].
The top-ranking and bottom-ranking teams for each season were defined as the first-place and last-place teams in the regular season, respectively, as shown in Table 1. Although the foreign player system was introduced in 2006, teams initially recruited foreign players through a free contract system, under which clubs directly signed players of their choice. However, beginning with the 2015-2016 season in the women’s league, a tryout-based recruitment system was implemented and has continued to the present [31]. To ensure consistency with the current foreign player recruitment structure, this study collected data starting from the 2015-2016 season.
| Season | Top-ranking Teams | Bottom-ranking Teams |
|---|---|---|
| 2015-2016 | IBK Altos Volleyball Club | Jung Kwan Jang Red Sparks Pro Volleyball Club |
| 2016-2017 | Heungkuk Life Insurance Volleyball Club Pinkspiders | Korea Expressway Women's Volleyball Club |
| 2017-2018 | Korea Expressway Women's Volleyball Club | Heungkuk Life Insurance Volleyball Club Pinkspiders |
| 2018-2019 | Heungkuk Life Insurance Volleyball Club Pinkspiders | Jung Kwan Jang Red Sparks Pro Volleyball Club |
| 2019-2020 | Hyundai Engineering & Construction Hillstate Volleyball Team | Korea Expressway Women's Volleyball Club |
| 2020-2021 | GS Caltex Seoul KIXX Volleyball Club | Hyundai Engineering & Construction Hillstate Volleyball Team |
| 2021-2022 | Hyundai Engineering & Construction Hillstate Volleyball Team | Pepper Savings Bank AI Peppers Volleyball Team |
| 2022-2023 | Heungkuk Life Insurance Volleyball Club Pinkspiders | Pepper Savings Bank AI Peppers Volleyball Team |
| 2023-2024 | Hyundai Engineering & Construction Hillstate Volleyball Team | Pepper Savings Bank AI Peppers Volleyball Team |
| 2024-2025 | Heungkuk Life Insurance Volleyball Club Pinkspiders | Pepper Savings Bank AI Peppers Volleyball Team |
The foreign players included in the analysis are summarized in Table 2. Under the KOVO foreign player system, each team is allowed to register only one foreign player per season. However, if a foreign player was unable to continue competing due to injury or unsatisfactory performance, the player could be replaced by another foreign player during the season. Since foreign players in the KOVO Women's League primarily occupy offensive positions, this study focused on their offensive performance indicators.
| Season | Top-ranking Team Players | Bottom-ranking Team Players | ||
|---|---|---|---|---|
| Nationality | Position | Nationality | Position | |
| 2015-2016 | USA | OP | USA | OP |
| 2016-2017 | Canada | OP | USA | OH |
| 2017-2018 | Serbia | OP | USA | OH |
| Belarus | OP | |||
| 2018-2019 | Poland | OH / OP | USA | OP |
| 2019-2020 | Spain | OH | USA | OP |
| USA | OP | USA | OP | |
| Cuba | OP | |||
| 2020-2021 | USA | OP | Belgium | OH |
| 2021-2022 | USA | OP | Hungary | OP |
| 2022-2023 | Bosnia and Herzegovina | OP | USA | OP |
| 2023-2024 | Cameroon | OP | USA | OP |
| 2024-2025 | Türkiye | OP | Croatia | OP |
| Poland | OP | USA | OP / MB | |
The dataset comprised all official KOVO match records of foreign players from both top- and bottom-ranking teams during the 2015–2016 to 2024–2025 seasons. Since all official match records meeting the inclusion criteria were collected, no missing values were identified in the team-level dataset. In the foreign-player dataset, matches in which the registered foreign player did not participate were treated as missing because no valid individual performance data were available. Consequently, missing values accounted for less than 2% of all observations, with missing data occurring more frequently among bottom-ranking teams than top-ranking teams. Because these missing values reflected actual player non-participation rather than measurement error, no data imputation was performed, and the missing values were retained throughout the analysis.
2.4. Model Performance Evaluation
The predictive performance of the model was evaluated using the Mean Absolute Error (MAE) and Root Mean Squared Error (RMSE), as summarized in Table 3. MAE and RMSE are widely used and well-established metrics for assessing prediction accuracy in time-series forecasting studies because they quantify the magnitude of prediction errors while offering complementary perspectives on model performance [32]. The MAE represents the average of the absolute differences between predicted and actual values, providing an easily interpretable measure of average prediction error. In contrast, the RMSE is the square root of the mean squared error and places greater emphasis on larger prediction errors [33].
| Category | MAE | RMSE | |
|---|---|---|---|
| Attack Efficiency Rate | Top-ranking teams | 5.52 | 6.93 |
| Bottom-ranking teams | 5.47 | 7.16 | |
| Foreign players in the top-ranking teams | 9.34 | 12.37 | |
| Foreign players in the bottom-ranking teams | 9.74 | 12.35 | |
| Attack Share Rate | Foreign players in the top-ranking teams | 5.65 | 7.31 |
| Foreign players in the bottom-ranking teams | 8.04 | 10.08 | |
| Average Number of Blocks Per Set | Top-ranking teams | 0.69 | 0.87 |
| Bottom-ranking teams | 0.62 | 0.80 | |
| Foreign players in the top-ranking teams | 0.30 | 0.38 | |
| Foreign players in the bottom-ranking teams | 0.45 | 0.68 | |
MAE and RMSE values approaching zero indicate higher predictive accuracy [34]. For percentage-based performance indicators, such as attack efficiency rate and attack share rate, previous studies have suggested that MAE values below 10 and RMSE values below 15 are indicative of acceptable forecasting performance [35]. Therefore, these metrics were used to evaluate the predictive accuracy of the forecasting models employed in this study. All MAE and RMSE values met the predefined criteria for acceptable forecasting performance, despite variations across performance indicators.
3. RESULTS
3.1. Attack Efficiency Rate
The forecasted attack efficiency results for the top-ranking and bottom-ranking teams in the upcoming season are presented in Fig. (1) and Table 4, respectively. The top-ranking teams were predicted to have attack efficiency values ranging from 27.084-32.959%, whereas the bottom-ranking teams were expected to achieve values between 22.357% and 26.025%.
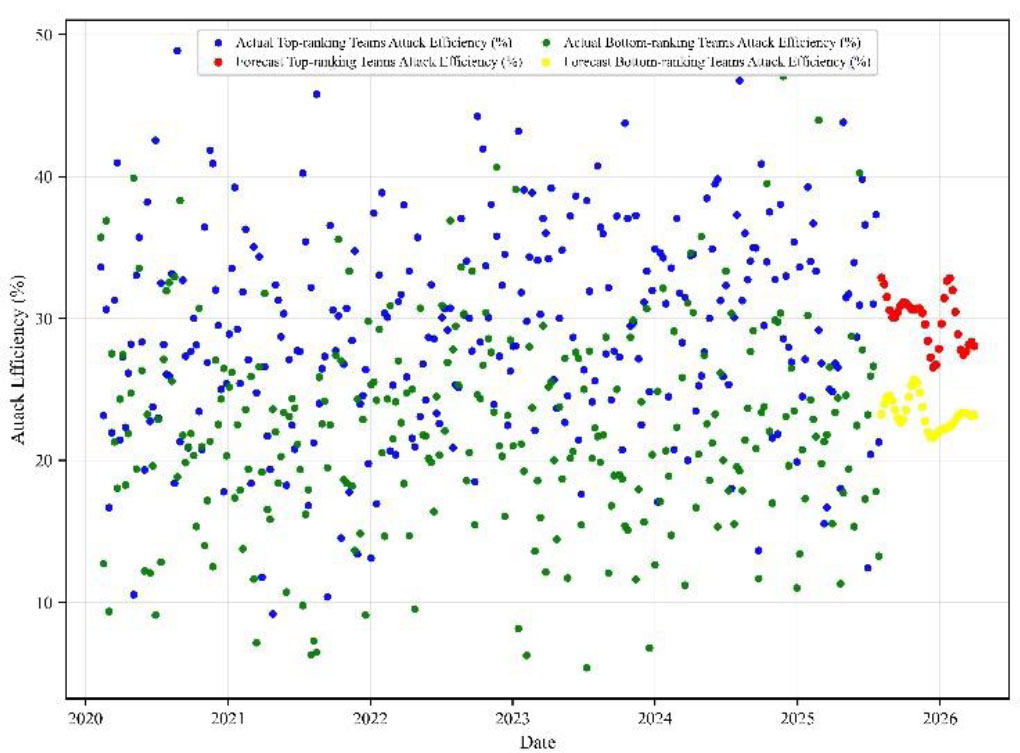
Forecasted team attack efficiency rates.
| Match | Top-ranking Teams | Bottom-ranking Teams | Foreign Players on the Top-ranking Teams | Foreign Players on the Bottom-ranking Teams |
|---|---|---|---|---|
| 1 | 32.471 | 23.105 | 34.959 | 27.887 |
| 2 | 32.959 | 23.621 | 34.670 | 28.654 |
| 3 | 32.529 | 24.167 | 33.866 | 28.762 |
| 4 | 31.545 | 24.557 | 32.967 | 28.107 |
| 5 | 30.525 | 24.657 | 32.414 | 26.827 |
| 6 | 29.897 | 24.451 | 32.461 | 25.265 |
| 7 | 29.826 | 24.059 | 33.060 | 23.850 |
| 8 | 30.193 | 23.695 | 33.925 | 22.953 |
| 9 | 30.710 | 23.573 | 34.712 | 22.768 |
| 10 | 31.100 | 23.815 | 35.214 | 23.269 |
| 11 | 31.239 | 24.392 | 35.469 | 24.244 |
| 12 | 31.189 | 25.122 | 35.708 | 25.383 |
| 13 | 31.116 | 25.746 | 36.181 | 26.383 |
| 14 | 31.145 | 26.025 | 36.948 | 27.025 |
| 15 | 31.255 | 25.833 | 37.770 | 27.204 |
| 16 | 31.264 | 25.209 | 38.163 | 26.928 |
| 17 | 30.935 | 24.331 | 37.619 | 26.282 |
| 18 | 30.139 | 23.444 | 35.879 | 25.407 |
| 19 | 28.980 | 22.765 | 33.132 | 24.484 |
| 20 | 27.806 | 22.407 | 30.023 | 23.715 |
| 21 | 27.084 | 22.357 | 27.441 | 23.302 |
| 22 | 27.188 | 22.506 | 26.181 | 23.396 |
| 23 | 28.204 | 22.712 | 26.623 | 24.032 |
| 24 | 29.846 | 22.869 | 28.566 | 25.085 |
| 25 | 31.550 | 22.945 | 31.320 | 26.263 |
| 26 | 32.698 | 22.978 | 33.990 | 27.173 |
| 27 | 32.878 | 23.034 | 35.844 | 27.441 |
| 28 | 32.064 | 23.165 | 36.587 | 26.854 |
| 29 | 30.617 | 23.370 | 36.418 | 25.465 |
| 30 | 29.116 | 23.599 | 35.865 | 23.608 |
| 31 | 28.089 | 23.783 | 35.471 | 21.811 |
| 32 | 27.783 | 23.869 | 35.504 | 20.617 |
| 33 | 28.068 | 23.854 | 35.834 | 20.396 |
| 34 | 28.538 | 23.780 | 36.021 | 21.206 |
| 35 | 28.742 | 23.709 | 35.586 | 22.771 |
| 36 | 28.435 | 23.685 | 34.306 | 24.584 |
The forecasted attack efficiency results of foreign players on both the top-ranking and bottom-ranking teams are presented in Fig. (2) and Table 4, respectively. Foreign players on the top-ranking team were predicted to achieve attack efficiency values between 26.181% and 38.163%, whereas those on the bottom-ranking teams were expected to achieve values ranging from 20.396-28.762%.
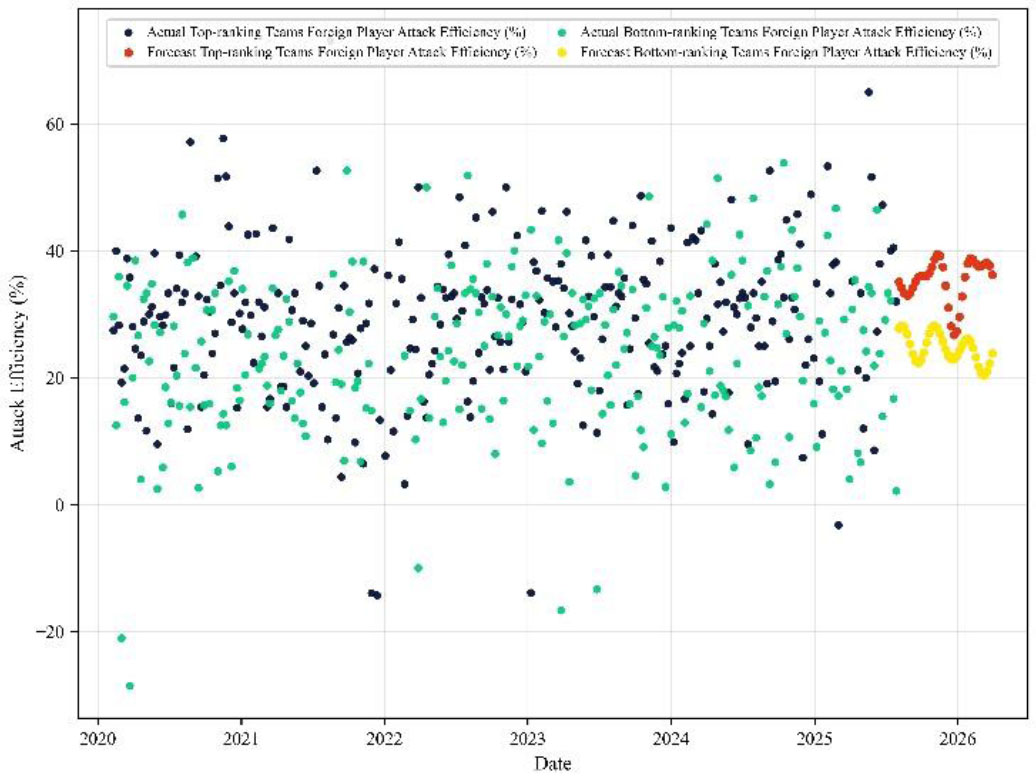
Forecasted foreign player attack efficiency rates.
The negative values shown in Fig. (2) correspond to actual observations in the dataset. Because attack efficiency is calculated by considering both successful and unsuccessful attacks [34], negative values may result when unsuccessful attacks and blocked attacks exceed successful attacks. Therefore, negative attack-efficiency values indicate poor offensive efficiency rather than data abnormalities and reflect the actual performance characteristics observed during matches.
3.2. Attack Share Rate
The forecasted attack share values of foreign players on the top-ranking and bottom-ranking teams are presented in Fig. (3) and Table 5, respectively. Foreign players on the top-ranking teams were predicted to have attack share values ranging from 22.281-28.699%, whereas those on the bottom-ranking teams were expected to have values ranging from 23.216-33.694%.
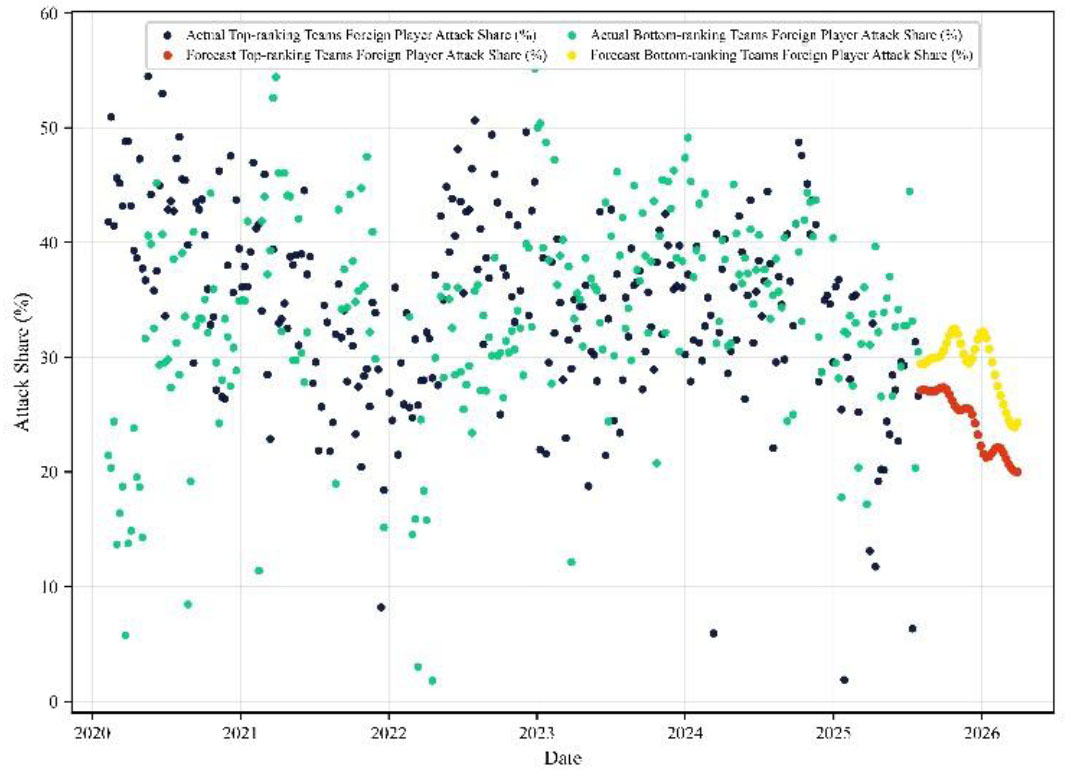
Forecasted foreign player attack share rates.
| Match | Foreign Players on the Top-ranking Teams | Foreign Players on the Bottom-ranking Teams |
|---|---|---|
| 1 | 28.324 | 31.743 |
| 2 | 28.635 | 31.599 |
| 3 | 28.641 | 31.709 |
| 4 | 28.309 | 32.007 |
| 5 | 27.785 | 32.319 |
| 6 | 27.316 | 32.463 |
| 7 | 27.133 | 32.350 |
| 8 | 27.327 | 32.047 |
| 9 | 27.812 | 31.749 |
| 10 | 28.357 | 31.681 |
| 11 | 28.699 | 31.973 |
| 12 | 28.671 | 32.575 |
| 13 | 28.273 | 33.256 |
| 14 | 27.675 | 33.694 |
| 15 | 27.128 | 33.629 |
| 16 | 26.842 | 32.985 |
| 17 | 26.879 | 31.929 |
| 18 | 27.127 | 30.816 |
| 19 | 27.350 | 30.044 |
| 20 | 27.306 | 29.890 |
| 21 | 26.862 | 30.387 |
| 22 | 26.060 | 31.306 |
| 23 | 25.101 | 32.245 |
| 24 | 24.253 | 32.784 |
| 25 | 23.734 | 32.641 |
| 26 | 23.616 | 31.766 |
| 27 | 23.802 | 30.328 |
| 28 | 24.084 | 28.631 |
| 29 | 24.239 | 26.983 |
| 30 | 24.130 | 25.596 |
| 31 | 23.756 | 24.552 |
| 32 | 23.239 | 23.832 |
| 33 | 22.746 | 23.390 |
| 34 | 22.413 | 23.216 |
| 35 | 22.281 | 23.354 |
| 36 | 22.301 | 23.859 |
3.3. Average Number of Blocks Per Set
The forecasted average number of blocks per set for the top-ranking and bottom-ranking teams in the upcoming season is presented in Fig. (4) and Table 6, respectively. The top-ranking teams were predicted to achieve values between 2.413 and 3.081, whereas the bottom-ranking teams were expected to range from 1.705-2.642.
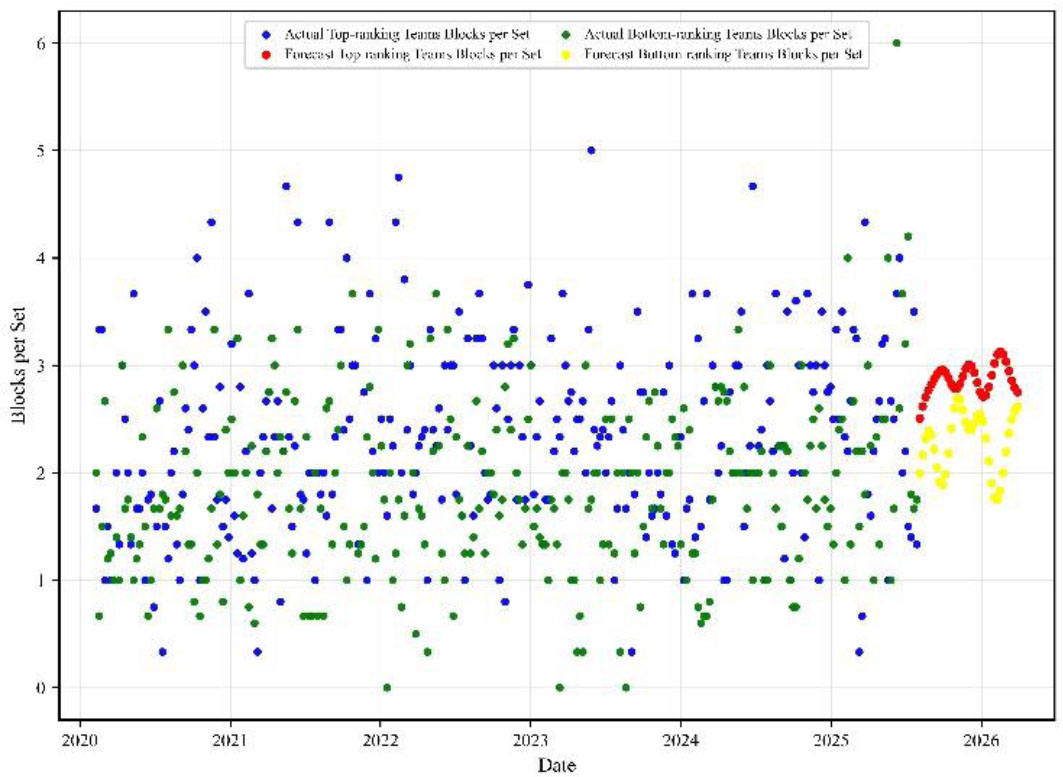
Forecasted team blocks per set.
| Match | Top-ranking Teams | Bottom-ranking Teams | Foreign Players on the Top-ranking Teams | Foreign Players on the Bottom-ranking Teams |
|---|---|---|---|---|
| 1 | 2.413 | 1.937 | 0.494 | 0.168 |
| 2 | 2.539 | 2.047 | 0.557 | 0.175 |
| 3 | 2.638 | 2.202 | 0.591 | 0.183 |
| 4 | 2.698 | 2.340 | 0.593 | 0.189 |
| 5 | 2.729 | 2.406 | 0.575 | 0.191 |
| 6 | 2.748 | 2.368 | 0.558 | 0.186 |
| 7 | 2.776 | 2.241 | 0.559 | 0.177 |
| 8 | 2.823 | 2.076 | 0.581 | 0.163 |
| 9 | 2.884 | 1.942 | 0.612 | 0.147 |
| 10 | 2.943 | 1.899 | 0.632 | 0.130 |
| 11 | 2.985 | 1.972 | 0.627 | 0.116 |
| 12 | 2.999 | 2.142 | 0.595 | 0.109 |
| 13 | 2.987 | 2.351 | 0.550 | 0.111 |
| 14 | 2.963 | 2.533 | 0.514 | 0.124 |
| 15 | 2.946 | 2.635 | 0.504 | 0.146 |
| 16 | 2.947 | 2.642 | 0.524 | 0.174 |
| 17 | 2.963 | 2.581 | 0.557 | 0.201 |
| 18 | 2.981 | 2.501 | 0.575 | 0.224 |
| 19 | 2.979 | 2.452 | 0.556 | 0.240 |
| 20 | 2.942 | 2.458 | 0.490 | 0.246 |
| 21 | 2.869 | 2.511 | 0.397 | 0.247 |
| 22 | 2.777 | 2.567 | 0.313 | 0.244 |
| 23 | 2.695 | 2.575 | 0.279 | 0.240 |
| 24 | 2.654 | 2.498 | 0.321 | 0.234 |
| 25 | 2.673 | 2.334 | 0.434 | 0.227 |
| 26 | 2.750 | 2.116 | 0.585 | 0.217 |
| 27 | 2.863 | 1.902 | 0.719 | 0.201 |
| 28 | 2.977 | 1.752 | 0.789 | 0.181 |
| 29 | 3.057 | 1.705 | 0.767 | 0.161 |
| 30 | 3.081 | 1.766 | 0.664 | 0.142 |
| 31 | 3.044 | 1.908 | 0.521 | 0.131 |
| 32 | 2.961 | 2.088 | 0.390 | 0.128 |
| 33 | 2.859 | 2.258 | 0.315 | 0.133 |
| 34 | 2.764 | 2.390 | 0.312 | 0.142 |
| 35 | 2.697 | 2.475 | 0.364 | 0.151 |
| 36 | 2.670 | 2.520 | 0.434 | 0.156 |
The forecasted average number of blocks per set for foreign players on the top-ranking and bottom-ranking teams is presented in Fig. (5) and Table 6, respectively. Foreign players on the top-ranking teams were predicted to achieve an average of 0.279-0.789 blocks per set, whereas those on the bottom-ranking teams were expected to achieve a range of 0.109-0.247 blocks per set.
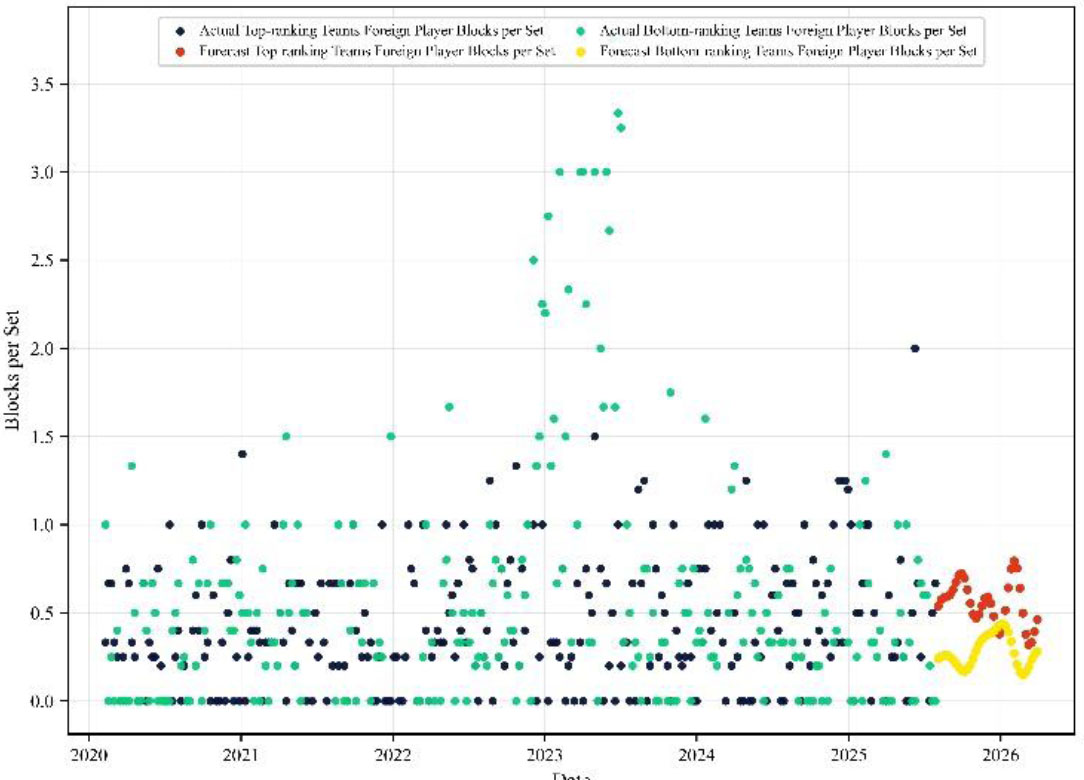
Forecasted foreign player blocks per set.
4. DISCUSSION
4.1. Attack Efficiency Rate
The forecasting results revealed a consistent difference in attack efficiency rates between top-ranking and bottom-ranking teams. This finding suggests that differences in competitive tiers may be reflected not only in the quantity of offensive opportunities but also in the effectiveness with which those opportunities are converted into points. Previous studies have identified offensive efficiency as one of the most influential performance indicators associated with successful volleyball performance [36]. In this context, the higher forecasted attack efficiency values observed among top-ranking teams may reflect a greater capacity to sustain effective offensive execution throughout a season. Collectively, these findings suggest that offensive efficiency is a distinguishing performance characteristic across competitive tiers in the Women’s Professional Volleyball League.
4.2. Attack Share Rate
Although foreign players on bottom-ranking teams were expected to account for a larger proportion of total attack attempts, their attack efficiency remained lower than that of foreign players on top-ranking teams. This finding suggests that a greater concentration of offensive opportunities among foreign players does not necessarily translate to higher offensive effectiveness. Furthermore, the relatively lower attack-share rates combined with higher attack efficiency observed in top-ranking teams may indicate a more balanced distribution of offensive responsibilities within the team structure. Therefore, differences in attack-share patterns seem to reflect contrasting offensive utilization characteristics across competitive tiers.
4.3. Average Number of Blocks Per Set
The forecasting results also demonstrated higher blocking values among top-ranking teams and their foreign players. Unlike attack-share rates, blocking performance exhibited a pattern similar to that observed for attack efficiency, suggesting that front-court performance characteristics may differ systematically across competitive tiers. Given that blocking serves as both a defensive and transitional performance indicator in volleyball [37], the observed differences may reflect broader performance characteristics associated with higher-ranking teams. Moreover, the higher blocking values forecasted for foreign players on top-ranking teams suggest that their contribution extends beyond offensive production and encompasses multiple aspects of match performance. These findings highlight the multidimensional role of foreign players within successful team environments.
5. LIMITATIONS
This study has several limitations. First, the analysis focused primarily on offensive performance indicators and did not include other technical and defensive aspects of volleyball performance, such as serve reception, digging, defensive coverage, or transition play. Consequently, the study was limited in its ability to comprehensively evaluate overall team and player performance. Future research should incorporate a broader range of offensive and defensive indicators and develop a more comprehensive performance assessment framework that reflects positional roles and tactical responsibilities.
Second, teams were classified into top-ranking and bottom-ranking groups based on regular-season standings to facilitate comparisons between contrasting competitive tiers. Although this approach enabled a clear comparison of performance characteristics, it may oversimplify the league’s competitive structure by excluding middle-ranking teams. Future research should examine the full ranking spectrum to provide a more comprehensive understanding of performance patterns across different competitive levels.
Finally, this study analyzed data collected across multiple seasons without explicitly accounting for season-specific contextual differences. Changes in roster composition, foreign player replacements, coaching staff, and competitive environments may influence team performance from season to season. Therefore, future studies should incorporate season-specific effects and contextual variables to enhance the interpretability and generalizability of forecasting results.
CONCLUSION
This study examined future trends in the offensive performance indicators of foreign players according to team ranking in the Women’s Professional Volleyball League. Top-ranking teams demonstrated higher attack efficiency rates and average numbers of blocks per set compared to bottom-ranking teams, whereas foreign players on bottom-ranking teams exhibited higher attack share rates. These findings suggest that offensive efficiency, offensive involvement, and blocking performance display distinct patterns across competitive tiers in the Women’s Professional Volleyball League.
AUTHORS’ CONTRIBUTIONS
The authors confirm their contributions to the paper as follows: J.Y.C. and D.I.L.: Study conception and design; J.Y.C.: Data collection, Draft manuscript, Methodology; D.I.L.: Conceptualization. All authors reviewed the results and approved the final version of the manuscript.
LIST OF ABBREVIATIONS
| OP | = Opposite Spiker |
| OH | = Outside Hitter |
| MB | = Middle Blocker |
ETHICS APPROVAL AND CONSENT TO PARTICIPATE
This study utilized publicly available secondary data from the official KOVO DB BANK and did not involve human participants or identifiable personal information. Therefore, approval from an Institutional Ethics Committee (IRB) and informed consent were not required. The Declaration of Helsinki was not applicable.
AVAILABILITY OF DATA AND MATERIALS
The dataset generated and analyzed during the current study is publicly available from the KOVO DB BANK (https://dbbank.kovo.co.kr).
ACKNOWLEDGEMENTS
Declared none.