All published articles of this journal are available on ScienceDirect.

Customer Satisfaction in 3x3 Basketball Tournaments and Perceived Service Quality: The Role of Socio-Demographic Characteristics
 iD
A. Ntovoli1 , 2
iD
A. Anastasiadis1
E. Kontaxakis3
iD
C. Galazoulas4
iD
A. Lola5
iD
iD
A. Ntovoli1 , 2
iD
A. Anastasiadis1
E. Kontaxakis3
iD
C. Galazoulas4
iD
A. Lola5
iD
Authors Info & Affiliations
Abstract
Introduction
3x3 basketball has rapidly evolved into a globally popular sport format, combining street basketball culture with structured competitive organization. Since its official recognition by FIBA and inclusion in the Olympic program, 3x3 tournaments have expanded worldwide, highlighting the importance of high-quality event organization. Understanding how participants perceive service quality and satisfaction across different socio-demographic groups is essential for the sustainable development of this emerging sport. The purpose of this study was to examine differences in perceived service quality and customer satisfaction in 3x3 basketball tournaments based on gender, age, educational level, occupation, and playing experience.
Methods
The sample consisted of 305 athletes (67 women, 238 men; mean age = 20.78 years) who participated in official 3x3 basketball tournaments in Central Macedonia, Greece. Data were collected during events organized by the Hellenic Basketball Federation, including the 3x3GR National Tour and the Panhellenic Tournament. Perceived service quality was assessed using a multidimensional sport service quality scale (facilities, personnel, responsiveness, reliability, and outcomes), while overall satisfaction was measured with a validated satisfaction scale. Data were analyzed using independent samples t-tests and one-way ANOVA with appropriate post hoc comparisons.
Results
The findings revealed statistically significant differences in service quality perceptions and satisfaction across several socio-demographic variables. Specifically, significant age differences were observed for satisfaction, F(7, 295) = 3.89, p < 0.001, η2 = 0.09, and facilities, F(7, 297) = 4.13, p < 0.001, η2 = 0.09, indicating moderate effect sizes. Educational level also showed significant differences in satisfaction, F(4, 298) = 7.39, p < 0.001, η2 = 0.09. Gender differences were observed only in the reliability dimension, t(302) = 2.30, p < 0.05, Cohen’s d = 0.32, with women reporting higher perceptions than men. No significant differences were found across playing positions.
Discussion
Perceived service quality and customer satisfaction in 3x3 basketball tournaments vary according to key socio-demographic characteristics. These findings underline the importance of participant-centered event design and targeted service strategies to enhance satisfaction and engagement.
Conclusion
Event organizers and sport governing bodies can use these insights to improve service delivery, strengthen participant experiences, and support the long-term growth and sustainability of 3x3 basketball.
1. INTRODUCTION
3x3 basketball has rapidly evolved from an informal, street-based activity into a globally recognized sport format that combines accessibility, entertainment, and high competitive intensity. Since its official recognition by the International Basketball Federation (FIBA) and its inclusion in the Olympic Games in 2020, 3x3 basketball has expanded internationally, attracting diverse participant groups and gaining prominence in urban public spaces [1-3]. Its fast pace, compact structure, and open participation model distinguish it from traditional 5-on-5 basketball and contribute to its growing popularity.
From a sport management perspective, 3×3 basketball tournaments can be conceptualized as service products consisting of core, tangible, and augmented elements. The core product reflects intrinsic motivations such as autonomy, competence, and social interaction [4], while tangible and augmented components include facilities, organization, staff behavior, and support services. Unlike traditional sports events held in permanent facilities, 3×3 basketball tournaments are often organized in temporary, outdoor environments with variable infrastructure and conditions. This creates a unique service setting in which reliability, responsiveness, and facility quality may fluctuate more significantly, potentially shaping participants’ evaluations in different ways. From a theoretical perspective, these contextual characteristics suggest that service quality in 3×3 basketball may operate differently compared to established sport settings, requiring context-specific investigation. Taken together, these elements shape participants’ perceptions of service quality, which has been consistently linked to satisfaction and positive behavioral intentions in sport settings [5, 6].
Participant satisfaction is a key outcome of perceived service quality in participatory sport events, influencing enjoyment, loyalty, and continued involvement [7, 8]. In 3x3 basketball tournaments, often hosted in open and temporary venues, organizational reliability, staff responsiveness, and facility adequacy play a critical role in shaping the overall event experience [9, 10]. Moreover, the structural characteristics of 3x3 basketball, including the half-court format and 12-second shot clock, heighten participants’ sensitivity to service quality, as even minor organizational shortcomings may disrupt game flow and enjoyment [11].
Previous research has demonstrated that perceptions of service quality and satisfaction vary across socio-demographic groups. Factors such as age, gender, educational level, occupation, and experience influence how sport services are evaluated, with younger participants emphasizing excitement and older or more experienced participants prioritizing organization, safety, and reliability [12]. However, despite the rapid growth and professionalization of 3x3 basketball, empirical evidence examining these differences within the context of 3x3 tournaments remains limited.
Therefore, the purpose of the present study was to examine differences in perceived service quality and customer satisfaction among participants in 3×3 basketball tournaments, based on key socio-demographic characteristics. By addressing this gap, the study aims to provide practical insights for event organizers and sport governing bodies seeking to enhance participant experiences and support the sustainable development of 3×3 basketball [9]. Specifically, the findings are expected to inform targeted service strategies, improve event design, and support evidence-based decision-making in participatory sport events, contributing to both theoretical advancement and practical applications in sport management.
Despite the extensive literature on service quality and satisfaction in sport settings, limited research has examined these constructs within emerging, participant-centered sport formats such as 3×3 basketball tournaments. These events are characterized by temporary infrastructures, open participation models, and dynamic service environments, which differentiate them from traditional sport settings. Therefore, understanding how service quality is perceived in such contexts remains an important but underexplored research area. The novelty of the present study lies in its focus on an emerging and rapidly evolving sport format, combined with a systematic examination of socio-demographic differences in participant-centered service quality perceptions and satisfaction.
2. LITERATURE REVIEW
2.1. Distinctive Features of 3x3 Basketball
3x3 basketball differs substantially from traditional 5-on-5 basketball in both its rules and game dynamics. Scoring is simplified, with field goals inside the arc awarded one point and shots beyond the arc awarded two points, placing greater emphasis on long-range shooting. Additionally, the 12-second shot clock, half the duration used in conventional basketball, demands rapid decision-making, continuous movement, and high-intensity play, resulting in a faster and more dynamic game flow [11]. These characteristics encourage improvisation, quick transitions, and sustained engagement, enhancing the overall playing experience.
Participation in street and recreational basketball, including 3x3 formats, offers important physical, psychological, and social benefits. Players often perceive basketball as a means of self-expression and social interaction, with satisfaction influenced by age, level of engagement, and leisure opportunities [3]. Regular participation has been associated with stronger social bonds and a greater sense of belonging, as well as improvements in physical health and psychological well-being [13-15].
Moreover, 3x3 basketball promotes accessibility and community engagement. Its open and flexible format accommodates participants of varying skill levels, lowering barriers to entry and supporting inclusivity [16]. The public and often festival-like atmosphere of 3x3 events further enhances the participant experience, creating an environment in which enjoyment, social interaction, and competition coexist.
2.2. Sport Event Service Quality
Service quality in sport events refers to participants’ evaluation of a planned and time-limited experience [17] and is grounded in broader service quality theory [18]. Early conceptualizations, such as SERVQUAL, emphasized multiple dimensions including tangibles, reliability, responsiveness, assurance, and empathy. Subsequent models streamlined these dimensions into broader components, such as interaction quality, outcome quality, and physical environment quality, which are more suitable for sport and event contexts [5, 19]. These frameworks have been widely applied in sport and event research [6, 20].
Empirical evidence consistently demonstrates that perceived event quality is a strong predictor of satisfaction, loyalty, and behavioral intentions [21]. Although earlier research primarily focused on spectators, more recent studies have shifted attention toward participatory sport events, emphasizing participant-centered attributes such as safety, flow, and well-being [15, 22, 23].
Event quality is widely regarded as a multidimensional construct. Measurement tools such as the Scale of Event Quality in Spectator Sports and its simplified adaptations offer practical approaches for assessing perceived quality using concise, event-specific indicators [24]. Across sport contexts, service quality has been shown to influence satisfaction and continued participation, with the alignment between participants’ expectations and perceived service performance playing a critical role in informing event management and marketing strategies [25].
2.3. Demographic Comparisons and Service Quality in Sport Services
Research has consistently shown that socio-demographic characteristics, including age, gender, occupation, and experience level, influence participants’ perceptions of service quality and overall customer experience in sport services. Younger participants tend to prioritize fast-paced and exciting aspects of sport events, whereas older participants place greater emphasis on organizational quality, safety, and convenience-related factors [5]. Gender differences have also been identified, with female participants often valuing opportunities for social interaction and supportive staff behavior, while male participants tend to focus more on competitive outcomes and physical environment quality, such as facilities and other tangible elements [6].
Experience level further differentiates perceptions of service quality and satisfaction. Novice participants typically emphasize guidance, accessibility, and organizational support, whereas more experienced participants focus on game quality, competition level, and interaction with co-participants [26]. In basketball contexts, perceptions related to competence and enjoyment have been shown to vary significantly according to prior experience and skill level, thereby influencing overall satisfaction.
Differences across demographic groups have also been observed in specific service quality dimensions, including interaction quality, physical environment quality, and outcome quality. Younger participants may tolerate minor organizational shortcomings when the event experience is exciting, whereas older or less experienced participants are more sensitive to deficiencies in facilities or staff support [24, 27]. Understanding these variations is essential for designing participant-centered sport services that align with diverse expectations and encourage sustained engagement.
2.4. Rationale
Despite the rapid growth and increasing professionalization of 3x3 basketball, empirical evidence examining socio-demographic differences in perceived service quality and customer satisfaction within this specific context remains limited. Existing research has primarily focused on the relationship between service quality and satisfaction, highlighting their significant association in sport settings, including 3x3 basketball tournaments [28]. Moreover, recent studies have emphasized the broader psychosocial dimensions of participation, such as social interaction, motivation, and well-being, which further underline the multifaceted nature of the 3x3 basketball experience [16]. However, there is still a lack of research exploring how these perceptions are differentiated across key socio-demographic characteristics.
Therefore, the present study aimed to compare service quality perceptions and customer satisfaction across gender, age, educational level, occupation, and experience among participants in 3x3 basketball tournaments. Addressing this gap offers valuable insights for event organizers, sport federations, and policymakers seeking to enhance participant engagement, promote inclusivity, and support the long-term sustainability of 3x3 basketball in local communities. Furthermore, understanding these perceptions can contribute to more targeted and effective management strategies, ultimately improving both the quality of services delivered and the overall participant experience [9, 16, 28, 29].
The present study aims to investigate and compare participants’ perceptions of service quality and their overall satisfaction in 3x3 basketball tournaments, with a particular focus on differences across key socio-demographic characteristics, including gender, age, educational level, occupation, and level of experience. Furthermore, the study seeks to deepen understanding of how these factors influence participants’ evaluations of sport service quality, thereby contributing to the development of more effective management strategies and enhancing participant experiences in 3x3 basketball events. From the aim of the present research, six hypotheses were formulated, which are as follows:
H1: There are statistically significant differences between gender groups in overall satisfaction and dimensions of sport service quality.
H2: There are statistically significant differences across player positions in satisfaction and service quality dimensions.
H3: There are statistically significant differences between age groups in satisfaction and service quality dimensions.
H4: There are statistically significant differences across educational levels in satisfaction and service quality dimensions.
H5: There are statistically significant differences across occupational groups in satisfaction and service quality dimensions.
H6: There are statistically significant differences based on experience-related variables (years in the same team, coaching experience, and years of playing basketball).
3. METHODOLOGY
3.1. Participants
The study sample included 305 athletes who took part in 3×3 basketball tournaments in Central Macedonia, Greece, comprising 67 women and 238 men. Participants had a mean age of 20.78 years. On average, they reported having played with the same team for 5.45 years and having overall basketball experience of 10.60 years. Data were gathered during official 3×3GR events, including the National Tour, the Panhellenic Tournament, and competitions organized by the Hellenic Basketball Federation (E.O.K.). All tournaments were held under the approval and supervision of the Hellenic Basketball Federation, and questionnaires were distributed and completed on-site during the tournament events. An a priori power analysis was conducted using G*Power 3.1 to ensure adequate sample size. Assuming a medium effect size (f = 0.25), α = 0.05, and power = 0.80, the required minimum sample size for ANOVA was lower than the obtained sample (N = 305), indicating sufficient statistical power. Inclusion and Exclusion Criteria. Eligible participants were active basketball athletes competing in official 3×3 basketball tournaments organized or approved by the Hellenic Basketball Federation (E.O.K.) in Central Macedonia, Greece. Participants were required to be registered members of their respective teams, have previous basketball playing experience, be actively engaged in competitive basketball at the time of data collection, voluntarily agree to participate in the study by providing informed consent, and complete the questionnaire during the official tournament events. Individuals who were not officially participating in the selected tournaments (e.g., coaches, referees, spectators, or volunteers), those who declined to provide informed consent, and participants who submitted questionnaires with substantial missing or incomplete responses were excluded from the study.
3.2. Instruments
Sport service quality was measured using a multidimensional scale developed by Alexandris et al. [5] and adapted to the context of the present study. The scale consisted of 14 items distributed across five dimensions: facilities, personnel, responsiveness, reliability, and outcomes. Indicative items referred to the appropriateness of the 3×3 basketball courts, coaches’ familiarity with the specific rules of 3×3 basketball, the speed with which team-related issues are addressed, the consistency of organizers in meeting their responsibilities, and the perceived contribution of tournament participation to players’ psychological well-being [5, 23]. Confirmatory factor analysis was used indicating that it is unidimensional with a good fit to the data (χ2(95) = 244.434, p < 0.001, CFI = 0.90, GFI = 0.98, SRMR = 0.06, CI90% [0.06-0.08], RMSEA = 0.07) and (χ2(67) = 152.152, p < 0.001, CFI = 0.93, GFI = 0.99, SRMR = 0.05, CI90% [0.05-0.08], RMSEA = 0.07). Cronbach α was also used indicating good reliability α=0.84. Specifically for facilities we had α=0.50, for personnel α=0.46, for responsiveness α=0.65, for reliability α=0.73 and for outcomes α=0.82. Participants’ satisfaction with 3×3 basketball was assessed using an adapted version of the satisfaction scale proposed by Alexandris et al. [5]. This instrument included 17 items representing a single, overall satisfaction dimension, capturing perceptions such as satisfaction with the level of entertainment provided by the tournaments. Confirmatory factor analysis was used, indicating that it is a five-dimensional model with a good fit to the data (χ2(67) = 152.152, p < 0.001, CFI = 0.93, GFI = 0.99, SRMR = 0.05, CI90% [0.05-0.08], RMSEA = 0.07), respectively. The internal consistency was assessed only for the total scale (Cronbach’s α =0.80). The statements were designed based on a 7-point Likert scale ranging from 1 (= totally disagree) to 7 (= totally agree).
3.3. Procedure
Before the commencement of data collection, ethical approval and permission to conduct the study were obtained from the Ethics Committee of the Department of Physical Education and Sport Sciences, Aristotle University of Thessaloniki, Greece (285/2025). Data were gathered during official 3×3 basketball tournaments held in the region of Central Macedonia. Participants were informed about the aims of the study and were assured that their responses would remain confidential and anonymous. Participation was entirely voluntary, and informed consent was secured from all participants prior to questionnaire completion. For participants under the age of 18, written parental/guardian consent was obtained, and the participants themselves provided assent prior to participation. The questionnaires were administered in person at the tournament venues immediately after athletes had completed their competitive activities, in order to enhance the accuracy and relevance of responses. The researcher was present throughout the process to provide any necessary clarifications and to ensure consistency and standardization in the data collection procedures. The study was conducted in accordance with the ethical principles of the Declaration of Helsinki. Data were collected exclusively by paper-based questionnaires administered on-site; no electronic devices or online survey platforms were used.
3.4. Statistical Analyses
Initially, descriptive statistics were used to describe the anthropometric characteristics, such as gender, educational level, occupation, and position. Moreover, an independent t-test was utilized to explore the differences between gender and satisfaction and service quality dimensions. Prior to the analysis, assumptions of normality and homogeneity of variances were assessed using the Kolmogorov–Smirnov test and Levene’s test, respectively. Analysis of variance (ANOVA) was used in order to investigate the differences between anthropometric characteristics and variables under investigation, i.e., Satisfaction and Service Quality dimensions. Bonferroni and Tamhane’s corrections were used for Post hoc analyses, depending on whether the variances are equal or not. In addition, effect sizes were calculated (Cohen’s d for t-tests and eta squared (η2) for ANOVA) to assess the magnitude of the observed differences. All statistical analyses were performed using SPSS (version 27) and R via JASP, with the level of statistical significance set at p < 0.05.
4. RESULTS
Descriptive statistics were used to describe the anthropometric characteristics. The participants had a mean age of 20.78 years (SD = 8.76). On average, they reported 5.45 years of experience playing for the same team (SD = 4.08) and a total basketball playing experience of 10.60 years (SD = 6.54). Based on the valid percentages, the sample mainly consists of men (78%), with women representing a lower percentage, 22%. Most participants have completed secondary education (55.4%), followed by primary education (19%), while 15.7% hold a bachelor’s degree. Smaller proportions have completed a master’s degree (5.2%) or vocational training (4.6%). In terms of occupation, half of the participants are school students (50.2%), while university students account for 23.9%. The remaining participants are mainly private sector employees (12.5%), with smaller shares being unemployed (5.2%), public sector employees (4.9%), and entrepreneurs (3.3%). Regarding playing position, the most common roles are shooting guard (28%) and point guard (26%), followed by power forward (17.1%), forward (16.8%), and center (12.2%). Regarding age distribution, the majority of participants were aged 13–18 years (54.4%), followed by those aged 19–24 years (23.0%). Together, these two groups accounted for 77.4% of the valid sample, indicating that the majority of participants were under 25 years of age. Participants aged 25–30 years represented 11.8% of the sample, while older age groups were much less frequent. Specifically, the 31–36 years group accounted for 3.6%, the 37–42 years group for 3%, and the 43–48 years group for 2.3% of the sample. The smallest proportions were observed in the 49–54 and 55–60 years age groups, each comprising 1.0% of the valid sample. This information is represented in Table 1.
| Gender | Frequency | Percent (%) | Valid Percent (%) | Cumulative Percent (%) |
|---|---|---|---|---|
| Women | 65 | 22 | 22 | 22 |
| Men | 238 | 78 | 78 | 100 |
| - | 305 | 100 | 100 | - |
| Educational Level | Frequency | Percent (%) | Valid Percent (%) | Cumulative Percent (%) |
| Primary education | 58 | 19 | 19 | 19 |
| Secondary education | 169 | 55.4 | 55.4 | 74.4 |
| Vocational training institute | 14 | 4.6 | 4.6 | 79 |
| Bachelor | 48 | 15.7 | 15.7 | 94.8 |
| Master | 16 | 5.2 | 5.2 | 100 |
| Total | 305 | 100 | 100 | - |
| Occupation | Frequency | Percent (%) | Valid Percent (%) | Cumulative Percent (%) |
| University student | 73 | 23.9 | 23.9 | 23.9 |
| Private sector employee | 38 | 12.5 | 12.5 | 36.4 |
| Entrepreneur | 10 | 3.3 | 3.3 | 39.7 |
| Public sector employee | 15 | 4.9 | 4.9 | 44.6 |
| Unemployed | 16 | 5.2 | 5.2 | 49.8 |
| School student | 153 | 50.2 | 50.2 | 100 |
| Position | Frequency | Percent (%) | Valid Percent (%) | Cumulative Percent (%) |
| Point guard | 79 | 25.9 | 26 | 26 |
| Shooting guard | 85 | 27.9 | 28 | 53.9 |
| Forward | 51 | 16.7 | 16.8 | 70.7 |
| Power forward | 52 | 17.0 | 17.1 | 87.8 |
| Center | 37 | 12.1 | 12.2 | 100 |
| Total | 304 | 99.7 | 100 | - |
| Age | Frequency | Percent (%) | Valid Percent (%) | Cumulative Percent (%) |
| 13-18 | 166 | 54.4 | 54.4 | 54.4 |
| 19-24 | 70 | 23 | 23 | 77.4 |
| 25-30 | 36 | 11.8 | 11.8 | 89.2 |
| 31-36 | 11 | 3.6 | 3.6 | 92.8 |
| 37-42 | 9 | 3.0 | 3 | 95.7 |
| 43-48 | 7 | 2.3 | 2.3 | 98 |
| 49-54 | 3 | 1 | 1 | 99 |
| 55-60 | 3 | 1 | 1 | 100 |
| Total | 305 | 100 | 100 | - |
Regarding years in the same team, nearly half of the participants reported 1 year in the same team (47.5%). Participants with 2 years accounted for 37.4%, while 7.2% reported 3 years. Smaller proportions were observed for 0 years (6.6%) and 4 years (1.3%). With respect to years as a coach, the majority of participants reported 1 year of coaching experience (71.5%). Participants with 2 years represented 16.4%, while 8.5% reported no coaching experience. Smaller percentages were observed for 3 years (3.0%) and 4 years (0.6%). Regarding years playing basketball, the majority of participants reported 1-10 years of playing experience (94.4%). A small percentage reported 21-30 years (3.6%) or 31-40 years (1.6%), while 0.3% reported 11-20 years of experience. This information is represented in Fig. (1).
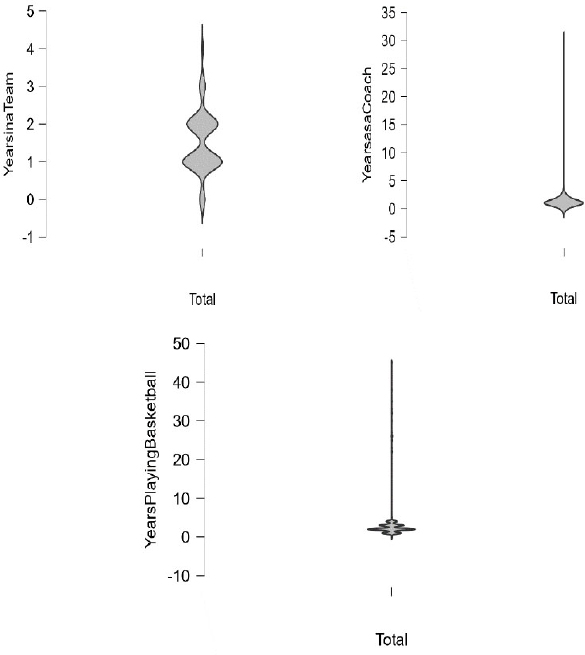
Violin plots for years in the same team, years as a coach, and years playing basketball.
Note: The figure illustrates the distribution and variability of years in the same team, years as a coach, and years of playing basketball. Wider sections of the violin indicate higher data density, while the inner boxplots represent median and interquartile ranges.
Independent samples t-tests were performed to examine differences between gender groups in overall satisfaction and the dimensions of sport service quality. The analysis showed no statistically significant differences for satisfaction, t(301) = 1.88, p = 0.06, Cohen’s d=0.26, indicating a small effect and limited practical significance. Moreover, there were no statistically significant differences between gender and facilities, t(303) = 1.03, p = 0.31, Cohen’s d=0.14, suggesting a trivial effect size. Furthermore, there were no statistically significant differences between gender and personnel, t(303) = 0.51, p = 0.61, Cohen’s d=0.07, indicating a negligible effect. Gender and responsiveness did not show statistically significant differences, t(303) = 1.01, p = 0.31, Cohen’s d=0.14, again reflecting a small practical effect. In contrast, statistically significant differences were shown between gender and reliability, t (302) = 2.30, p < 0.05, Cohen’s d=0.32, indicating that the two groups differed significantly in their perceptions of reliability. Specifically, women (M=5.50, SD=1.16) showed higher reliability than men (M=5.10, SD=1.28), with a small-to-moderate effect size, suggesting a modest practical difference. Gender and outcomes did not show statistically significant differences, t (303) = 1.37, p = 0.171, Cohen’s d=0.19, indicating a small effect size and limited practical relevance. This information is represented in Fig. (2).
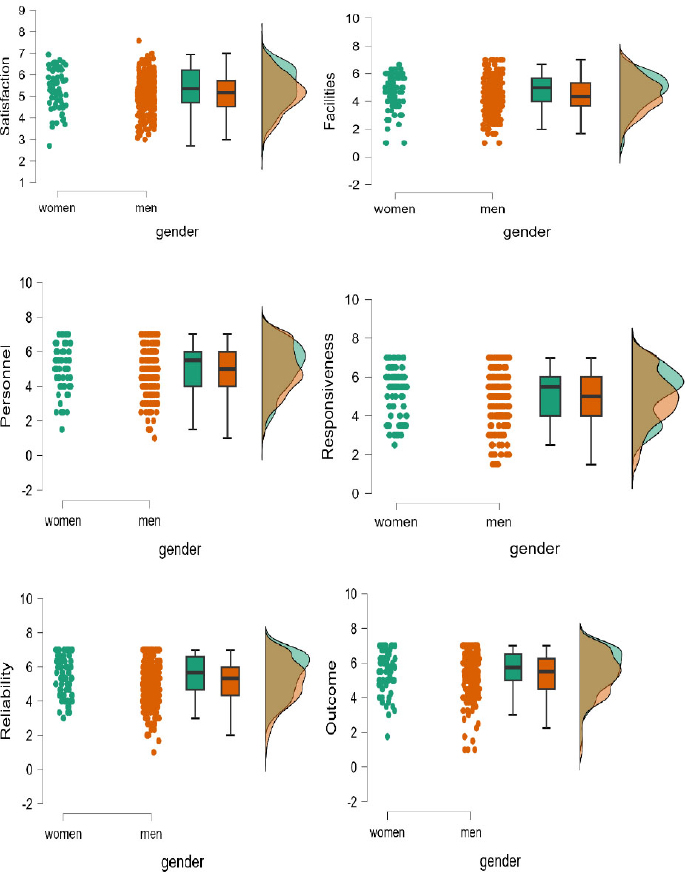
Raincloud figures for satisfaction and dimensions of service quality.
Note: The figure presents raincloud plots illustrating the distribution, central tendency, and variability of satisfaction and service quality dimensions. The combination of density plots, boxplots, and individual observations provides a comprehensive visualization of group distributions.
An ANOVA analysis was conducted to examine differences across player positions in satisfaction and dimensions of service quality. The results revealed that there were no statistically significant differences for any of the variables under investigation. An analysis of variance was also used in order to explore the differences between the age groups and the variables under investigation, suggesting that player position has no meaningful practical impact on service quality perceptions or satisfaction. Statistically significant differences were shown between age groups and satisfaction, F(7, 295) = 3.89, p < 0.001, η2=0.09, indicating a moderate effect size and meaningful practical differences between groups. Specifically, Tamhane’s correction showed statistically significant differences were found between the age group of 37-42 and the age group of 13-18, with the first group showing more satisfaction from 3x3 than the second group (MD=0.61, p < 0.01), representing a moderate practical difference. Moreover, there was a difference between 43-48 and 13-18, with the first group showing more satisfaction (MD=0.68, p < 0.05), also indicating a moderate effect. Similarly, there was a statistically significant difference between age groups and facilities, with F(7, 297) = 4.132 and p < 0.001, η2=0.09, suggesting a moderate practical effect. Therefore, perceptions of facilities vary between the groups of 37-42 and 13-18, with the first group showing a higher mean than the second group (MD=1.17, p < 0.001), indicating a substantial practical difference. This information is represented in Table 2.
| Variable | Source | Sum of Squares | df | Mean Square | F | Sig. (p) | η2 |
|---|---|---|---|---|---|---|---|
| Satisfaction | Between Groups | 20.93 | 7 | 2.99 | 3.89 | 0.000 | 0.09 |
| - | Within Groups | 226.59 | 295 | 0.77 | - | - | - |
| - | Total | 247.52 | 302 | - | - | - | - |
| Facilities | Between Groups | 44.14 | 7 | 6.31 | 4.13 | 0.000 | 0.09 |
| - | Within Groups | 453.22 | 297 | 1.53 | - | - | - |
| - | Total | 497.35 | 304 | - | - | - | - |
Note: η2 values indicate the magnitude of the effect (practical significance). According to conventional benchmarks, η2 ≈ 0.01 represents a small effect, 0.06 a medium effect, and 0.14 a large effect. Both Satisfaction and Facilities show medium effect sizes, indicating meaningful practical differences between groups in addition to statistical significance.
An Analysis of Variance (ANOVA) was also conducted to investigate differences among the educational levels in overall Satisfaction and in dimensions of Sport Service Quality. The results highlighted some statistically significant differences. Specifically, the results indicated statistically significant differences between groups for Satisfaction, F(4, 298) = 7.39, p < 0.001, η2=0.09, indicating a moderate effect size and meaningful practical differences across educational groups. Post-hoc comparisons with Bonferroni’s correction showed statistically significant differences for Satisfaction, mainly involving primary education with secondary education. Higher satisfaction was reported in secondary education (M =5.25, SD=0.89) than in primary education (M =4.62, SD=0.81), suggesting a notable practical difference. Similarly, individuals with university education showed significantly higher satisfaction compared to the primary education group (MD = 0.75, p < 0.001). In addition, master’s graduates also reported significantly higher satisfaction than those in primary education (MD = 0.87, p < 0.01). Similarly, significant group differences were found for Facilities, F (4, 300) = 2.89, p < 0.05, η2=0.04, indicating a small practical effect. Specifically, post-hoc comparisons did not reveal any statistically significant differences between the educational groups, suggesting limited practical relevance of this finding. Finally, the ANOVA also revealed statistically significant differences between age groups and Responsiveness, F(4, 300) = 3.14, p < 0.05, η2=0.04, indicating a small effect size. Bonferroni’s correction showed statistically significant differences between students in primary and secondary education, with the students in the second group showing higher perceptions of responsiveness (MD = 0.63, p < 0.05), reflecting a small-to-moderate practical difference. This information is presented in Table 3.
| Variable | Source | Sum of Squares | df | Mean Square | F | Sig. (p) | η2 |
|---|---|---|---|---|---|---|---|
| Satisfaction | Between groups | 22.35 | 4 | 5.59 | 7.39 | 0.00 | 0.09 |
| - | Within groups | 225.17 | 298 | 0.76 | - | - | - |
| - | Total | 247.52 | 302 | - | - | - | - |
| Facilities | Between groups | 18.43 | 4 | 4.61 | 2.89 | 0.02 | 0.04 |
| - | Within groups | 478.92 | 300 | 1.60 | - | - | - |
| - | Total | 497.35 | 304 | - | - | - | - |
| Responsiveness | Between groups | 22.44 | 4 | 5.61 | 3.14 | 0.02 | 0.04 |
| - | Within groups | 535.67 | 300 | 1.79 | - | - | - |
| - | Total | 558.10 | 304 | - | - | - | - |
Note: η2 values represent effect sizes and indicate the magnitude of group differences (practical significance). According to conventional benchmarks, values around 0.01 indicate small effects, 0.06 medium effects, and 0.14 large effects.
An analysis of variance (ANOVA) was also used to investigate differences between the variables under investigation and occupation. Statistically significant differences were found among the groups of occupation and Satisfaction, F(5, 297) = 7.72, p < 0.001, η2=0.09, indicating a moderate effect size. Specifically, it was found that university students showed more satisfaction from 3x3 (MD=0.70, p < 0.001) than school students; entrepreneurs also showed more satisfaction than public sector employees (MD=1.49, p < 0.05), and entrepreneurs showed more satisfaction than school students (MD=1.63, p < 0.01), suggesting meaningful practical differences between occupational groups. Moreover, statistically significant differences were found between unemployed and school students, with the first group showing more satisfaction (MD=1.16, p < 0.01). Similarly, significant group differences were observed between Occupation and Facilities, F(5, 299) = 7.07, p < 0.001, η2=0.04, indicating a small effect size. The results showed that university students showed again higher perceptions of facilities than school students (MD=0.57, p < 0.05), entrepreneurs also showed higher perceptions of facilities than public sector employees (MD=1.49, p < 0.05), entrepreneurs also showed higher perceptions of facilities than school students (MD=1.63, p < 0.01). Furthermore, unemployed individuals showed higher perceptions of facilities than school students (MD=1.16, p < 0.01). Finally, the analysis also showed statistically significant differences between Occupation and Outcome, F(5, 299) = 2.55, p < 0.05, η2=0.01 indicating a very small practical effect. Specifically, university students showed higher perceptions of outcomes than school students (MD=0.49, p < 0.05). This information is represented in Table 4.
| Variable | Source | Sum of Squares | df | Mean Square | F | Sig. (p) | η2 |
|---|---|---|---|---|---|---|---|
| Satisfaction | Between groups | 28.47 | 5 | 5.69 | 7.72 | 0.000 | 0.09 |
| - | Within groups | 219.04 | 297 | 0.74 | - | - | - |
| - | Total | 247.52 | 302 | - | - | - | - |
| Facilities | Between groups | 52.59 | 5 | 10.52 | 7.07 | 0.000 | 0.04 |
| - | Within groups | 444.77 | 299 | 1.49 | - | - | - |
| - | Total | 497.35 | 304 | - | - | - | - |
| Outcomes | Between groups | 19.63 | 5 | 3.93 | 2.55 | 0.028 | 0.01 |
| - | Within groups | 460.89 | 299 | 1.54 | - | - | - |
| - | Total | 480.52 | 304 | - | - | - | - |
Note: η2 values indicate effect sizes representing the magnitude of group differences (practical significance). According to conventional benchmarks, values of approximately 0.01 indicate small effects, 0.06 medium effects, and 0.14 large effects.
An analysis of variance was also used to investigate differences between Satisfaction and dimensions of Sport Quality and Years in the same team. The results indicated a statistically significant difference between the groups and Facilities, F(4, 300) = 2.96, p < 0.05, η2=0.04, indicating limited practical significance. The Post Hoc analysis showed no differences between the groups. An ANOVA was also conducted to examine differences between Satisfaction and dimensions of Sport Quality and Years as a Coach. Statistically significant differences were revealed among the groups, F(5, 299) = 3.10, p < 0.05, η2=0.05, suggesting modest practical relevance. The Post Hoc analysis showed no differences between the groups. An analysis of variance was also used to investigate differences between Satisfaction and dimensions of Sport Quality and years of playing basketball. Statistically significant differences were revealed among the groups and facilities, F(3, 301) = 6.91, p < 0.01, η2=0.06, indicating a small-to-moderate practical effect. This information is represented in Table 5.
| Variable | Source | Sum of Squares | df | Mean Square | F | Sig. (p) | η2 |
|---|---|---|---|---|---|---|---|
| - | Years in the same team | - | - | - | - | - | - |
| Facilities | Between groups | 18.86 | 4 | 4.72 | 2.96 | 0.020 | 0.04 |
| - | Within groups | 478.49 | 300 | 1.60 | - | - | - |
| - | Total | 497.35 | 304 | - | - | - | - |
| - | Years as a coach | - | - | - | - | - | - |
| Facilities | Between groups | 24.52 | 5 | 4.90 | 3.10 | 0.010 | 0.05 |
| - | Within groups | 472.84 | 299 | 1.58 | - | - | - |
| - | Total | 497.35 | 304 | - | - | - | - |
| - | Years playing basketball | - | - | - | - | - | - |
| Facilities | Between groups | 32.06 | 3 | 10.69 | 6.91 | 0.000 | 0.06 |
| - | Within groups | 465.29 | 301 | 1.55 | - | - | - |
| - | Total | 497.35 | 304 | - | - | - | - |
Note: Effect sizes (η2) are reported to complement statistical significance and indicate the practical importance of group differences. The results indicate small to moderate effects for Years in the same team (η2 = 0.04), Years as a coach (η2 = 0.05), and Years of playing basketball (η2 = 0.06), suggesting that experience-related variables have a limited but non-negligible influence on perceived facilities.
5. DISCUSSION
The present study examined socio-demographic differences in perceived service quality and satisfaction among athletes participating in 3×3 basketball tournaments in Central Macedonia, Greece. Overall, the findings support the broader service quality literature suggesting that evaluations of sport services reflect both the delivered performance and participants’ expectation standards, which vary systematically across population segments [18, 19, 24, 27]. Importantly, the largely “stable” pattern across several dimensions (limited gender effects; selective demographic effects) may indicate that 3×3 events deliver a relatively standardized core experience, while certain aspects (e.g., reliability, facilities) remain more sensitive to participant characteristics.
Regarding gender, the absence of statistically significant differences in overall satisfaction and most service quality dimensions, paired with a significant difference only in reliability, suggests a nuanced gender pattern rather than a generalized one. Reliability typically captures consistency, dependability, and the extent to which event promises are met [18], and has been highlighted as a key determinant of positive sport service evaluations in applied contexts [5, 12]. A critical interpretation is that women may use reliability cues (e.g., predictable scheduling, clear enforcement of rules, consistent organizational support) as a stronger “trust signal,” especially in outdoor/temporary-event conditions where uncertainty can be higher. However, the small-to-moderate effect size also suggests caution against overgeneralization; rather than “gender per se,” reliability differences might reflect differential exposure to risk or differential sensitivity to organizational ambiguity, which future research could assess with targeted measures (e.g., perceived safety, informational clarity, fairness).
Age differences were more pronounced, with older participants reporting higher satisfaction and more positive facility evaluations than younger athletes. This aligns with the idea that perceived quality is partly an “expectations–performance” comparison, and younger cohorts often hold higher standards shaped by exposure to professionalized sport content and social-media benchmarks [18, 30]. From a sport venue and servicescape perspective, physical environment perceptions are strongly linked to satisfaction and future intentions [24, 31], making facility-related findings particularly meaningful. A critical implication is that facility adequacy may not be a “neutral background” in 3×3 tournaments, but a core experiential driver for younger players. Therefore, organizers should consider whether facility investments (court surface, lighting, spatial layout, signage, waiting areas) disproportionately influence younger segments’ satisfaction and retention.
Educational-level differences (higher satisfaction and responsiveness perceptions among participants with higher education) can be interpreted in at least two ways. First, higher education may be associated with greater familiarity with structured services and clearer schemas for evaluating organizational performance, which can lead to more differentiated (and sometimes more favorable) appraisals of responsiveness. Second, and more critically, lower ratings among primary-education participants could reflect unmet needs in communication and support (e.g., unclear procedures, limited guidance), suggesting that “responsiveness” is partly an accessibility issue. This interpretation fits broader event-quality approaches that treat personnel/service systems and information delivery as central quality components [20, 24]. Practically, improving micro-level responsiveness (help desk visibility, proactive staff guidance, simplified instructions) may reduce inequities in event experience across educational groups.
Occupational differences (satisfaction, facilities, outcomes) also point to the role of lifestyle constraints and time resources. Here, the critical angle is that satisfaction may be influenced not only by event performance but also by the “fit” between event design and participants’ everyday constraints. For example, groups with more flexible schedules may experience tournaments as leisure-enhancing and autonomy-supportive, while groups with stricter schedules may perceive delays or organizational friction as more costly. This resonates with sport event service perspectives showing that quality influences satisfaction and future intentions, but the pathways can be moderated by situational and segment-level factors [21, 32].
Experience effects, particularly the association between years of playing and facility perceptions, are theoretically consistent with the notion that more experienced participants possess stronger reference standards and evaluate technical/functional attributes more stringently. In sport services, experienced consumers often rely more on “technical” and environment-based cues (e.g., sportscape quality, equipment, space functionality), which can shape satisfaction and repeat intentions [10, 31]. The fact that post hoc tests did not always pinpoint clear group contrasts may indicate limited power within subgroups or uneven distribution across categories. A constructive, critical recommendation is that future studies should model experience as a continuous predictor (or use finer categories) and test interactions (e.g., age × experience) to better capture how standards are formed.
Therefore, the findings reinforce the multidimensional structure of sport event quality and service quality frameworks and extend them to an emerging participatory sport format [12, 19, 20, 24]. They also suggest that 3×3 organizers may benefit from a segmented quality strategy: reliability and communication processes may matter disproportionately for certain groups (e.g., women; lower education), while facility/ service environment enhancements may be especially decisive for younger and more experienced participants [31]. Finally, given that service quality effects on satisfaction and behavioral outcomes are well established across sport contexts [32], improving these targeted elements could contribute meaningfully to retention and positive word-of-mouth in 3×3 tournaments.
6. IMPLICATIONS FOR PRACTICE
The findings of the present study underline the importance of adopting a participant-centered approach when designing, managing, and delivering 3×3 basketball tournaments. Demographic and experiential differences among athletes suggest that a “one-size-fits-all” event model may not be sufficient to maximize satisfaction and long-term engagement in this rapidly growing sport format.
First, particular attention should be paid to the reliability of event organization, as this dimension was perceived differently across gender groups. Reliability encompasses not only the consistency of service delivery but also the credibility of communication, adherence to schedules, and transparent enforcement of rules. Organizers should ensure that information regarding game schedules, rules, and event procedures is communicated clearly and consistently through both formal and informal channels. Additionally, visible safety measures and well-trained staff can reinforce athletes’ trust in the event and contribute to a predictable and secure playing environment.
Second, variations in satisfaction and facility perceptions across age, educational level, occupation, and experience highlight the need for flexible and targeted event design. Younger and more experienced athletes, in particular, may place greater emphasis on facility quality, court conditions, and overall event professionalism. Investments in high-quality playing surfaces, adequate lighting, clear signage, and comfortable waiting areas can substantially enhance the experience of these groups. At the same time, participants with lower educational levels or limited experience may benefit from enhanced staff responsiveness, guidance, and support throughout the event.
Finally, organizers and governing bodies should actively seek to understand the expectations and constraints of different participant groups before and after tournaments. Collecting systematic feedback, engaging athletes in evaluation processes, and using these insights to adapt event offerings can improve satisfaction, encourage repeat participation, and foster positive word-of-mouth. By tailoring service delivery to the diverse needs of participants, 3×3 basketball tournaments can strengthen their appeal, inclusivity, and sustainability within local communities.
7. LIMITATIONS AND FUTURE RESEARCH
Despite its contributions, this study has several limitations that should be acknowledged. Data were collected from 3×3 basketball tournaments in a single geographical region (Central Macedonia, Greece), which may limit the generalizability of the findings to other cultural, geographical, or sport contexts. In addition, the cross-sectional design does not allow for causal conclusions regarding the relationships between demographic characteristics, service quality perceptions, and satisfaction. Furthermore, the study relied exclusively on self-reported data, which may be subject to common method bias and social desirability effects. Future studies could benefit from incorporating multiple data sources or objective performance indicators to enhance validity. Another limitation concerns the analytical approach, as the study primarily employed group comparison techniques (t-tests and ANOVA). Although appropriate for the research purpose, these methods do not capture more complex relationships among variables. Future research could apply more advanced multivariate techniques, such as Structural Equation Modeling (SEM), to examine the underlying mechanisms linking service quality and satisfaction. Additionally, the measurement of service quality was based on adapted instruments, which, although grounded in prior literature, may not fully capture the unique characteristics of the 3×3 basketball context. Further validation of context-specific measurement tools is therefore recommended. Additionally, the sample was characterized by an uneven distribution in terms of age and gender, with the majority of participants being under 25 years old and male. This imbalance may limit the generalizability of the findings, as perceptions of service quality and satisfaction may differ across more diverse or balanced populations. Future research should aim to include more heterogeneous samples to better capture variations across demographic groups. Furthermore, data were collected using self-reported measures immediately after the tournament, which may have introduced social desirability bias. Although participants were assured of anonymity and confidentiality, they may have provided more favorable evaluations of service quality and satisfaction. Therefore, the findings should be interpreted with some caution. Future research could address this issue by incorporating social desirability scales or using alternative data collection methods, such as longitudinal designs or mixed-method approaches. Future research should examine these relationships using longitudinal designs, apply the proposed framework to different sport events and countries, and incorporate qualitative or mixed-methods approaches to gain deeper insight into participants’ experiences. Further investigation of additional factors, such as cultural background, motivation, competitive level, or team performance, may also enhance understanding of service quality and satisfaction in participatory sport events.
CONCLUSION
This study contributes to the growing literature on participatory sport events by demonstrating that athletes’ perceptions of service quality and satisfaction in 3×3 basketball tournaments are shaped by key socio-demographic and experiential characteristics. Differences related to gender, age, educational level, occupation, and basketball experience highlight that participant evaluations are not uniform and depend on distinct expectations, reference standards, and life contexts. By focusing on an emerging and increasingly professionalized sport format, the findings extend established service quality frameworks to the unique setting of 3×3 basketball tournaments.
Beyond their theoretical contribution, the results offer practical value for event organizers and sport governing bodies. Understanding how different participant groups evaluate reliability, facilities, and overall event quality can support more targeted and effective event design, ultimately enhancing satisfaction, encouraging repeat participation, and strengthening the sustainability of 3×3 basketball initiatives. As 3×3 basketball continues to expand globally, adopting participant-centered service strategies informed by empirical evidence will be essential for delivering high-quality event experiences and supporting the long-term growth of the sport.
AUTHORS’ CONTRIBUTIONS
The authors confirm their contributions to the paper as follows: D.S., G.S., A.L.: Study conception and design; D.S., A.N.: Data collection; G.S., A.A., E.K.: Analysis and interpretation of results; D.S., G.S., A.N.; E.K., A.A., C.G., and A.L.: Draft manuscript. All authors reviewed the results and approved the final version of the manuscript.
LIST OF ABBREVIATIONS
| FIBA | = International Basketball Federation |
| ANOVA | = Analysis of Variance |
| SEM | = Structural Equation Modeling |
ETHICS APPROVAL AND CONSENT TO PARTICIPATE
The study involving human participants received ethical approval from Ethics Committee of the Department of Physical Education and Sport Sciences, Aristotle University of Thessaloniki, Iraq, approval/reference number 285/2025.
HUMAN AND ANIMAL RIGHTS
All human research procedures followed were in accordance with the ethical standards of the committee responsible for human experimentation (institutional and national), and with the Helsinki Declaration of 1975, as revised in 2013.
CONSENT FOR PUBLICATION
Informed consent was obtained from all participants prior to their participation in the study. The participants were informed about the purpose of the study, the voluntary nature of their participation, and the confidentiality and anonymity of their data.
AVAILABILITY OF DATA AND MATERIALS
The data supporting the findings of this study are not publicly available due to ethical and privacy considerations concerning the participants. The data may be made available by the corresponding author [G.S] upon reasonable request, subject to appropriate ethical and institutional restrictions.
ACKNOWLEDGEMENTS
Declared none.