All published articles of this journal are available on ScienceDirect.

Identifying the Most Successful Formula 1 Drivers in the Turbo Era
Abstract
Background:
Formula 1 is the world’s fastest auto racing circuit and one that is among the most-watched of all televised sports. With its international flair and glamor and the glitz it brings to viewers and spectators, it is no surprise that fans, commentators, and media covering the races enjoy ranking the most successful teams and especially the most successful drivers of all time. Yet, there are few empirical studies that have developed and/or applied rigorous methodological techniques to examine which drivers are the most successful within the recent turbo-hybrid era.
Objective:
This study uses novel group-based trajectory methods to rank the most successful drivers within the turbo area, 2014-2019.
Methods:
Group-based trajectory methods are used to identify distinct groups of drivers according to accumulated points.
Results:
Using total points accumulated during each respective season as our measure of success, results showed that the 45 drivers who competed during this time period could be classified into three groups, with the top-performing group of drivers being Lewis Hamilton and Nico Rosberg. A second better-performing group of six drivers followed and included Bottas, LeClerc, Räikkönen, Ricciardo, Verstappen, and Vettel. The remaining 37 drivers were classified into a third low-performing group, a great number of which scored zero points during the time period.
Conclusion:
The most successful Formula 1 drivers during the turbo era were able to be identified using group-based trajectory modeling, with Lewis Hamilton and Nico Rosberg identified as the best drivers based on accumulated points.
1. INTRODUCTION
Sports fans love to rank ‘best’ teams and ‘best’ athletes. But what does ‘best’ really mean? Does it mean most home runs in baseball? Does it mean most tennis championships? Does it mean most victories by a team? Does it mean most shutouts by a goalie? All of these are different ways of measuring success in individual and team sports. As one can imagine, the lists and methodologies used to arrive at the ‘best’ or ‘most successful’ athlete are varied and at times controversial. This is because it is very difficult to compare athletes within a sport ‘all time’ because the games change, the athletes’ training varies, and the rules and regulations develop over the years. For example, professional baseball pitchers in the middle part of the 20th century would regularly pitch nine innings. Today, they barely pitch five or six. Many other sport-specific examples abound, but the key to any ranking lies within some sort of comparable year(s) in order to keep as many rules/regulations the same or as standardized as possible. This is also the case with the world’s most-watched televised and commercial sport, Formula 1 (F1) [1], and the topic of this paper. Herein, we use a novel methodology, group-based modeling, to assess the most successful F1 drivers in the turbo era using total points accumulated as the metric of success.
2. BACKGROUND
F1 has a checkered (no pun) history, filled with the glitter and glamor of flying around the world, racing on the streets of Monte Carlo, the famed Silverstone course in Britain, to the evening race in Shanghai, and the specifically built-for-F1 course in Abu Dhabi. The lifestyles of the rich and famous (not the television show) are what F1 is all about. Given its popularity, there are of course, all-time rankings (on many different outcome criteria), many of which are subjective, but some objective ones rely on a range of different sources of data, methodologies, and assumptions.
For example, the popular, but the quantitatively sophisticated website, fivethirtyeight.com, used the ELO rating system, originally designed to calculate the relative skill level of players competing in head-to-head matches, but was modified to deal with the intricacies of competing against a dozen or more drivers at one point, in order to create a ranking. With adjustments made to the scoring system and because the report’s authors [2] “wanted to strike a balance between career performance and peak form”, they had to make a compromise that had them average “a driver’s Elo across the five best consecutive seasons of his or her career, provided the driver participated in a minimum percentage of that season’s races.”1
In a ranking of the thirty drivers who met the minimum criteria to receive an ELO score, the top two drivers of all time were Ayrton Senna (ELO=2178; 1988-1992) and Michael Schumacher (ELO=2106; 2000-2004), and they were followed by modern-day drivers Lewis Hamilton (ELO=2060; 2014-2018) and Sebastian Vettel (ELO=2056; 2009-2013). These top four would almost certainly come to the tip of the tongue of many die-hard F1 fans, given the skill, prowess, victories, and championships that these four drivers had/have accumulated over the course of their careers.
Another study attempted to rank the best drivers since 2000, including a list of 28 drivers in this period (including 23 winners), and developed a model that took into account a number of key features of the racers and their cars, including race victories, points, and how a driver fared against his teammates [3]. Specifically, Slater’s model operated as follows: “To limit the effect a drivers' machinery has on the rating we “weighted” the points and race wins to come up with an adjusted total. This has been done by looking at how competitive the drivers' cars were during each season. For example, if a driver wins in a race in a car that came fourth in the championship, that win should be worth more than a win from a driver whose team dominated a season, likewise, with points. The weighted points are divided by the Grands Prix they entered in this period to limit the effect of longevity on their ratings. From this, they get a weighted points/GP score. This is then combined with the weighted victories and then multiplied by their teammate ratio (the bottom line) to give a final rating. Weighted points only adjust so much, so we have also included a +/- rating for the weighted points and wins. This should show how much a driver outperformed their machinery but, naturally, does not favour drivers who spent much of this period in dominant cars.”2 The results derived from Slater’s analysis indicated that the top three drivers were: (3) Michael Schumacher (Rating=3439), (2) Sebastian Vettel (Rating=3751), and (1) Lewis Hamilton (Rating=4620). Again, using a different methodology, many of the same drivers emerged at the front of the pack.
Within academia, there has been much less empirical research with respect to driver rankings, but three of the most prominent studies are highlighted here. The landmark, an empirical study, was from Eichenberger and Stadelmann [4]. Using 57 years of data (1950-2006) that focused on a subsample of drivers who competed in at least forty races, these authors employed a variety of control variables including, for example, the number of drivers finishing, technical and human breakdowns, and weather conditions in an effort to predict as the ultimate dependent variable the finishing position of the driver. Their analysis was designed to parcel out the driver, and car effects showed that Juan Manuel Fangio and Jim Clark were the two ‘best drivers’. In fact, Fangio not only led the talent ranking, but he also won on other relative measures, including race points and wins, all the while outperforming the strong competition on the same car.
An important extension of this study estimated driver and team contributions to estimate peak performance in an analysis of F1 drivers from 1950-2013 [5]. Examining the subsample of drivers with at least one season of three counting races and after adjusting for team and competition effects, and comparing driver performances using peak performance for various yearly intervals and the number of championships, the five greatest drivers were found to be Jim Clark, Jackie Stewart, Juan Manual Fangio, Fernando Alonso, and Michael Schumacher. Phillips also observed that differences in performance between teams were typically larger than differences in performance between drivers (p.267).
Finally, in one of the most comprehensive analyses to date ranking the best F1 drivers of all time, Bell et al. modelled F1 driver and (car) constructor performance between 1950 and 2014 [6]. More specifically, the authors focused on ranking the best F1 drivers of all time, conditional on team performance, how much teams and drivers mattered, and finally, how the driver and team effects varied over time and under different racing conditions (i.e., wet weather). Their results identified Juan Manuel Fangio as the greatest driver of all time, that team effects were more important than driver effects, but that such effects may be reduced in wet weather and street tracks. The wet-weather finding is especially pertinent since mid- or low-field teams enjoy wet weather because it helps to de-emphasize the large advantage that the top teams, with top budgets, enjoy under sunny conditions.
2.1. Current Study Objective
Formula 1 is one of the world’s most exciting and most-watched sporting events, and not surprisingly, there are a host of opinions on who the all-time great drivers are. Yet, less research has emerged on this question from the academically-oriented empirical literature. This paper adds to this small knowledge base by focusing on driver performance in the turbo era (2014-2019) to provide a steady-state comparison (unlike analyses that focus on a 50-year time span) and also introduces a methodology that is novel to this area of work, semi-parametric group-based models, which helps to classify drivers into unique groups. Specifically, we attempt to identify the most successful F1 drivers during the turbo era using total points accumulated as our metric of success. Such a study offers this area of research the first application of the group-based model to examine F1 driver success in the turbo era, thereby offering a key methodological innovation to the analysis of ranking F1 drivers in the turbo era.
2.2. Data
This paper focuses on the period starting in 2014 when F1 changed engine configurations from 2.4 litre V8 engines to 1.6 litre V6 turbo engines through the end of the 2019 season. Within this time period, the outcome variable used to rank the most successful F1 drivers was the total number of points. This particular outcome was selected because drivers need to accumulate the most points possible in order to vie for the driver’s championship (aside from the constructor’s championship), which is awarded to the driver with the most number of points. Other scholars have used driver classification or several world championships, but in the turbo era, the championships have been won by one team (Mercedes) and only two drivers (Nico Rosberg, won in 2016, while Lewis Hamilton won in 2014, 2015, 2017, 2018, and 2019).3 As a result, an application of the group-based model would not yield any insight into success because of the lack of variability in driver championships. Therefore, the number of total points accumulated throughout the overall years permits much more information (i.e., variability) to the model in order to parcel out potential heterogeneity between drivers over the time period examined.4
Data on the total number of points accumulated by the drivers were obtained from the website: http://f1-facts.com /results/season/ for each season between 2014-2019 (accessed April 10, 2020). The top 10 finishers are awarded points. Since 2010, the podium (top 3 racers) finishers have been awarded 25, 18, and 15 points, respectively, for first, second and third place. One notable change occurred in 2019 when F1 added one additional point for the fastest lap.
3. MATERIALS AND METHODS
3.1. Methodology: Group-based Trajectory Applied to Total Points Accumulated by F1 Racers
This paper is the first F1 driver ranking study to use group-based modeling that was originally developed for the analysis of criminal offending patterns over the life course [7]. This semi-parametric group-based trajectory modelling approach was designed to identify and then partition the heterogeneity of individual criminal activity into homogenous groups of offenders who follow (roughly) the same trajectory of criminal activity over a period of time. Akin to latent class or cluster analysis, the methodology analyzes the behavior of interest (outcome variable) over time and then groups ‘like’ trajectories into larger, more homogenous groups. In doing so, the modeling approach calculates the likelihood of each unit of analysis (driver in our case) being in each of the identified groups (based on total points accumulated) and then assigns them to the group to which they have the highest probability of belonging to. Of course, there can be some error in placing individuals in certain groups. Therefore group assignment is never perfect. Nevertheless, various fit statistics provide information regarding the confidence within which units are assigned to a more-correct group. This technique has been used in well over a Hundred analysis of various issues, including criminal activity, worldwide web usage, etc., and is routinely used to answer questions about heterogeneity in behavior across the social and medical sciences [8].
The group-based method begins with estimating a series of model permutations, starting with a two-group model and proceeding to additional specifications each time adding an additional group. The variable of interest is the total number of points accumulated by each of the respective groups of F1 drivers. Using a series of model fit statistics, a decision is then made on which model ends up being the best-fitting model. With respect to the fit statistics, we employ both the Akaike Information Criterion (AIC) and the Bayesian Information Criterion (BIC) as fit criteria to infer the correct number of groups in the mixture model. In addition, we also consider the percentage of cases (i.e., F1 drivers) in each of the mixtures that emerge from the group-based modeling procedure. Finally, we provide the posterior probability assignments, which “measures the probability that an individual with a specific behavioral profile belongs to a specific trajectory group” and “are a valuable tool for easy and transparent communication of findings on the distinctive characteristics and outcomes of individuals following different trajectories” (7, p.78, p.83). It is advised that posterior probability assignments should be as close to 1.0 as possible (indicating the perfect assignment of the driver to each of the respective groups that emerge from the mixture model), but assignments over .7 are the floor of acceptability.
In short, this study also follows the general guidelines for trajectory model analyses, featuring multiple steps to identify the accurate modeling for groups and presenting visualized group trajectories. In particular, the model specification with model fit statistics is conducted first, and then the group trajectories, based on total points accumulated, are visualized according to the performance of each of the F1 drivers. All these steps are taken in order to “summarize the distinctive features of the data in as parsimonious a fashion as possible” (7, p.77).
4. RESULTS
Over the time period examined, there were a total of 45 different drivers competing in F1 Grand Prix throughout the world. Not all of them competed every year between 2014 and 2019. Although this is technically an unbalanced panel (not every driver is observed for every time period), the modeling procedure accommodates this feature without penalty. Additionally, during this time period, the total number of points varied from a high of 2,336 (Lewis Hamilton) to a low of zero which was accumulated by thirteen different drivers. In between these high and low point totals, four drivers accumulated over 1,000 points (Rosberg (1,024), Ricciardo (1,107), Bottas (1,286), and Vettel (1,539)) and two other drivers scored between 500-999 (Räikkönen and Verstappen). One final point: Charles LeClerc, who contributed two years of data to the study (2018 with Alfa-Romeo and 2019 with Ferrari), accumulated 303 total points, of which 264 were with Ferrari in 2019.
As can be seen, there is quite a bit of heterogeneity in the total points accumulated data. There clearly is one driver that is way above everyone else (Hamilton), but we still have questions about the performance of other drivers, i.e., are others scoring high more ‘like him’ than they are others? Are there a sizable number of drivers behind Hamilton but more like one another than the other drivers in the data? That is precisely what the group-based methodology is designed to address, and to which we next turn with respect to our investigation of the most successful F1 drivers during the turbo era.
Table 1 provides the results of our modeling procedure where we estimated up to a five-group model, at which point the model no longer converged with more groups (a common feature of the model when there is too little heterogeneity left to parcel out into a meaningful classification). These results, which were based on the censored normal version of the procedure, indicate that the three-group model is the best-fitting model.
| Number of Groups | Log-Likelihood | AIC | BIC |
|---|---|---|---|
| 2 | -672.21 | -680.21 | -687.44 |
| 3 | -648.41 | -660.41 | -671.25 |
| 4 | -644.77 | -660.77 | -675.22 |
| 5 | -640.19 | -660.19 | -678.26 |
Table 2 provides the specific fit statistics and case distribution for the three-group model. As shown, there are 37 drivers in Group 1 (low-performing; 82.95% of the sample), 6 in Group 2 (better-performing; 12.59% of the sample), and 2 in Group 3 (top-performing; 4.4% of the sample). Importantly, the average posterior probability (AvePP) for membership in the assigned group is advised to be higher than .7 in all groups, and the odds of correct classification (OCC) should be greater than 5 for all groups [7]. Based on the guidelines for model-fit values, this model seems to have good separations while having a relatively acceptable model, showing that the estimates for AvePP are well above .9, with two at .99 suggesting very strong assignment probability.5
| Group | N | Avepp | OCC | Class Prop. | Pred.Prop. | ||
|---|---|---|---|---|---|---|---|
| Group 1 | Group 2 | Group 3 | |||||
| 1 = Low | 37 | 0.997 | 0.002 | 0.000 | 85.103 | 0.822 | 0.830 |
| 2 = Better | 6 | 0.070 | 0.929 | 0.000 | 85.518 | 0.133 | 0.126 |
| 3 = Top | 2 | 0.000 | 0.000 | 0.999 | 4345884 | 0.044 | 0.044 |
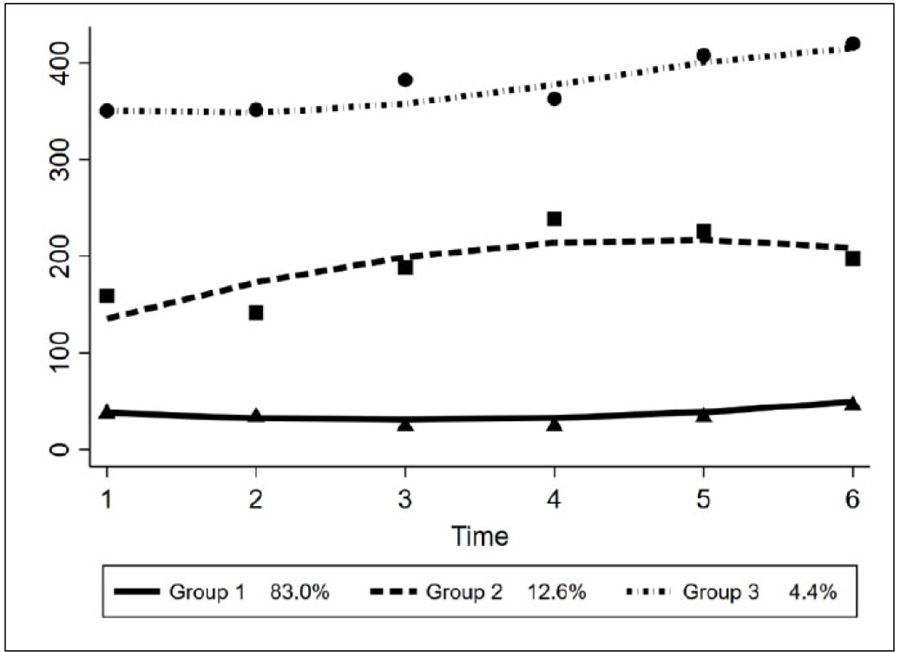
Fig. (1) presents a trajectory plot for the three-group solution. As can be seen, the two drivers (Hamilton and Rosberg) in Group 3 (top-performing) consistently score the most number of points over time, e.g., ~300-400 points, while group 2 (better-performing) lies in the middle, e.g., 100-200 points, and then the larger group 1 (low-performing), e.g., less than 50 points.
Table 3 provides the driver distribution across the three groups. A few things are worth mentioning here. First, the top-performing group (Group 3) contains just two drivers: Lewis Hamilton and Nico Rosberg. Both drivers were Mercedes teammates during the turbo era, yet what is interesting to note is that Rosberg only provides three years of data while Hamilton contributes data for the entire time period (2014-2019). Interestingly, Rosberg has fewer total points accumulated during the observation period of the study than some of the other high-scoring drivers, such as Vettel, but the likely reason as to why he is included in the top-performing group with Hamilton is that these two drivers were the top-scoring racers during the three years of Rosberg’s driving (with Rosberg winning the title in his last year, 2016).
| Number | Group 1 (Low-Performing) | Group 2 (Better-Performing) | Group 3 (Top-Performing) |
|---|---|---|---|
| 1 | Fernando Alonso | Valtteri Bottas | Lewis Hamilton |
| 2 | Felipe Massa | Charles LeClerc | Nico Rosberg |
| 3 | Jensen Button | Kimi Räikkönen | - |
| 4 | Nico Hulkenberg | Daniel Ricciardo | - |
| 5 | Sergio Perez | Max Verstappen | - |
| 6 | Kevin Magnussen | Sebastian Vettel | - |
| 7 | Jean-Eric Vergne | - | - |
| 8 | Romain Grosjean | - | - |
| 9 | Daniil Kvyat | - | - |
| 10 | Pastor Maldonado | - | - |
| 11 | Jules Bianchi | - | - |
| 12 | Adrian Sutil | - | - |
| 13 | Marcus Ericsson | - | - |
| 14 | Esteban Gutierrez | - | - |
| 15 | Max Chilton | - | - |
| 16 | Kamui Kobayashi | - | - |
| 17 | Will Stevens | - | - |
| 18 | Andre Lotterer | - | - |
| 19 | Felipe Nasr | - | - |
| 20 | Carlos Sainz | - | - |
| 21 | Roberto Merhi | - | - |
| 22 | Alexander Rossi | - | - |
| 23 | Jolyon Palmer | - | - |
| 24 | Pascal Wehrlein | - | - |
| 25 | Stoffel Vandoorne | - | - |
| 26 | Esteban Ocon | - | - |
| 27 | Rio Haryanto | - | - |
| 28 | Lance Stroll | - | - |
| 29 | Pierre Gasly | - | - |
| 30 | Antonio Giovinazzi | - | - |
| 31 | Brendon Hartley | - | - |
| 32 | Paul Di Resta | - | - |
| 33 | Sergey Sirotkin | - | - |
| 34 | Alexander Albon | - | - |
| 35 | Lando Norris | - | - |
| 36 | George Russell | - | - |
| 37 | Robert Kubica | - | - |
In the better-performing group (Group 2), we see some of the world’s best drivers, such as Vettel, Bottas, and Ricciardo. What is really interesting about the make-up of this group is the inclusion of Verstappen and especially LeClerc. The former started his F1 career in 2015, where he earned a mere 47 total points. Yet, from 2016 through 2019, he averaged well over 200 points. The latter, however, only had two years of data to provide to the model, but the second year of LeClerc’s tenure in F1 (2019) saw him move to Ferrari, and he dueled his teammate Vettel all season long, actually outscoring him 264 to 240. Finally, Group 3 contains the low-performing drivers, comparatively speaking vis-à-vis the other two groups. Many of the drivers in this list incurred zero points during their tenure, but others scored quite well, and in fact, the list contains former F1 world champions Button and Alonso. Yet, these individuals accumulated their best scoring points and titles prior to the introduction of the turbo-era in 2014.
5. DISCUSSION
Formula 1 auto racing is the most expensive and popular (as judged by worldwide television ratings) sport in the world [9]. Over the past twenty years, researchers have explored various aspects of Formula 1, including, for example, tourism and the regional economy [1], crime in and around the United States Grand Prix in Austin, Texas [10], and competitive advantage over time [11]. This paper continues in the tradition of research on Formula 1 in an effort to identify the most successful drivers in the turbo era of Formula 1 auto racing, from 2014 through 20196, with respect to total points accumulated. Using a novel methodological approach, group-based trajectory modeling, that is designed to identify unique groups of individuals (in our case, F1 drivers) who follow similar trajectories over time (in our case based on the total number of points accumulated), our results showed that there were three distinct groups of drivers who accumulated total points in heterogeneous ways.
More specifically, our results showed that one group of drivers were a cut above the rest. This group, however, only had two drivers: Nico Rosberg and Lewis Hamilton. These two drivers scored many more points than their colleagues during the turbo period-even though Rosberg retired in 2016. The second group of drivers, comprised of six men, also clustered together and were right behind the top-performing group. Some of these drivers are closer to the end of their careers (Vettel), while others are at the beginning (Verstappen and LeClerc). The third group of drivers filled out the remainder of the larger group of forty-five men who raced during the turbo area, many of whom scored zero points. Regarding this third group, it is important to bear in mind that many of them are younger drivers and who are on low-budget teams. It will be interesting to follow their careers over time and see how they mature and older drivers retire from the sport.
In some ways, our results are comparable to prior studies, but in other ways, they are not since we were focused solely on the turbo era. That aside, where our study overlaps with the time period(s) of prior research, Lewis Hamilton always rises to the top of the list, regardless of the outcome used to determine the ‘top’ or ‘best’ or ‘most successful’ driver. On the other hand, we cannot compare our results to those studies that focused on the time period prior to the turbo era and the few years subsequent to that when Hamilton, Alonso, and Vettel were racing. Most of the prior research dated well back into the mid to latter part of the 20th century. What would be interesting, however, would be to apply the group-based methodology to those prior studies to see if this approach yields similar or different insights. Or put more succinctly: would Schumacher, Fangio, Clark, and Alonso still rank among the best? While improvements in cars, technology, and driver fitness are likely to vary over time, findings on ways to consider these aspects with respect to driver (and team) performance would be illuminating.
6. LIMITATIONS
Our study is the first analysis of driver rankings using total points accumulated during the turbo area using a novel methodological approach. While our findings are unique in that regard, some data limitations need to be recognized, several of which present opportunities for subsequent research. First, our analysis was purposely focused on the hybrid era which has been largely dominated by one driver, Lewis Hamilton, and one team, Mercedes Benz. A question that has been at the fore of prior research is the juxtaposition of driver and car, which matters more (if either do). Our analysis did not employ such a correction for ‘team reliability’ or ‘team budget’, the latter which is a closely guarded figure. Yet, it is well-known that most F1 drivers are exceptional athletes who, if given the right car, will excel. Two ideal examples were Bottas when he moved from Williams to Mercedes and LeClerc when he moved from Alfa-Romeo to Ferrari. Following their switch to these high-budget, high-performing teams, the drivers were racing at the front of the field. Unfortunately, the turbo era has been filled with more stability at the top (Hamilton with Mercedes), making the incorporation of such a correction difficult and likely fruitless to a degree. However, change awaits the future of F1 as in the next few years 7 as teams will be restricted with budget caps in order to create a more even playing field, and some of the top-performing drivers are likely to be close to retirement (Hamilton, Vettel) or have retired already (Rosberg). As well, some drivers who have stepped away from F1, such as Alonso, are returning back to F1, with Alonso’s return in 2021 with Alpine, thereby making competition more interesting and perhaps more equitable. Of course, this change is expected to contribute to boosting the popularity of F1 as the uncertainty in outcomes and more balanced competitions are likely to attract more television viewers and event visitors [12]. In short, the continued analyses of driver rankings with the upcoming changes may alter the pattern of results in the current study.
A second limitation of our work is that we did not consider additional variables above and beyond the driver and total points accumulated. Aside from team designation and team budgets, other variables might also alter driver performance, especially on certain courses. It has been argued that weather conditions influence races, whether due to car performance, tire performance, tire X car performance, or driver interaction with any of these would be of interest going forward. Also of interest would be analyses of the driver by circuit, and given the changes in circuits, with some new ones coming on board and others fading out, additional work in this area may be of interest.
CONCLUSION
In the end, there will never be a cessation of ranking professional athletes based on some definition of success, whether by individual statistics, victories, or championships. Our work in this space focused on Formula 1 drivers in the turbo area. Lewis Hamilton and Nico Rosberg, drivers for Mercedes Benz, were identified to be in the top-performing group using group-based methodology that is designed to isolate distinct patterns of behavior over time, in our case, total points accumulated. Future studies tracking drivers, points, car manufacturers, and upcoming changes to the rules and regulations, especially team budgets, may alter how the drivers are parceled across groups based on performance.
NOTES
1 As noted by Moore et al. (2018): “Driver and car are considered to be inseparable from Elo’s point of view. So when we say that Nigel Mansell’s peak Elo in 1992 was 2428, we really mean, “Nigel Mansell, driving the Williams-Renault FW14B, had a peak Elo of 2428. Each session or race is treated as if it were a round-robin 1-on-1 tournament. A driver who finishes second out of 15 cars is viewed as having gone 13-1 in this tournament, losing to the first place finisher and defeating the rest. Elo includes each race that awards Formula One championship points ([e]except for the Indianapolis 500, which was part of the Formula One circuit in the 1950s) and the primary qualifying session for that race. If a driver fails to finish a race — whether because of mechanical failure or a crash — we treat that driver as if he or she didn’t compete in the race. This may reward drivers who are overly brave (or stupid) by not punishing them, or cars that were quick yet unreliable, but it avoids having to assign blame in controversial incidents or, even worse, clear cases where a crash was not a driver’s fault” (https://fivethirtyeight.com/features/formula-one-racing/#fn-3; accessed October 7, 2020).
2 With respect to the final feature of Slater’s analysis, consider the case of Valtteri Bottas. When he was with Williams, he had a subpar car—especially when compared to the cars fielded by Mercedes Benz and Ferrari. Yet, when he moved to the Mercedes team at the beginning of the 2017 season, his points immediately skyrocketed.
3 Prior to the hybrid era, Sebastian Vettel won the driver’s championship in a Red Bull each year from 2010 through 2013. Prior to that Jenson Button won in 2009 and Lewis Hamilton won his first championship in 2008 with McLaren.
4 An anonymous reviewer offered good insight regarding how one classifies the ‘best’ or most ‘successful’ driver. Specifically, they asked rhetorically, “is not the “best” driver the driver who wins the championship?” This is an excellent point, one that deals with how one defines ‘success’ or ‘most successful’ in a sport that is not just about a single individual, as is the case in F1, where drivers rely on pit crews, team principals, and the technology of their car. As we reviewed both the popular and academic literature, different writers operationalized ‘best’ and ‘most successful’ in different ways, but we did find more often than not that total points accumulated was important—especially because the more points a driver accumulates the higher the likelihood that they would win a championship. During the period of our analysis, the turbo era, it was the case that the championships were dominated by one team, Mercedes-Benz. Therefore, we could not use championships as the outcome of interest because there would be no variation, despite the fact that there were two individual drivers who won individual championships for that same team. All of this aside, we believe that much more attention should be devoted to assessing different metrics of success over longer periods of time within the F1 context as well as with other sports more generally. We thank the anonymous reviewer for this excellent suggestion.
5 Another point worth making regarding the estimates provided in Table 2 are how the Avepp values are distributed across the classifications. In particular, it can be seen that group 1 has a very high value of being assigned to its group (0.997) but almost zero likelihood of being assigned to groups 2 (0.002) and 3 (0.000). Similarly, group 3 has almost a perfect assignment probability to its group. It is only for group 2 where there is some slight variability with respect to group membership. Group 2 enjoys a high likelihood of being assigned to itself (0.929), no chance of being assigned to group 3, and a 0.070 chance of being assigned to group 1. Thus, there is some very small degree of potential misclassification here as some of the drivers assigned to the middle group had features that resembled the two drivers assigned to the most successful group with respect to total points accumulated, but it is very small, and the fit statistics are very strong and well above the recommended minimum threshold of .7 for assignments.
6 https://www.autosport.com/f1/news/whos-the-best-formula-1-driver-schumacher-hamilton-senna-more-4983210/4983210/ (accessed November 5, 2021).
7 https://www.bbc.com/sport/formula1/52723209, accessed May 22, 2020.
ETHICS APPROVAL AND CONSENT TO PARTICIPATE
Not applicable.
HUMAN AND ANIMAL RIGHTS
No animals/humans were used for studies that are the basis of this research.
CONSENT FOR PUBLICATION
Not applicable.
AVAILABILITY OF DATA AND MATERIALS
The data sets used during the current study can be provided from the corresponding author [A.R.P], upon reasonable request.
FUNDING
Not applicable.
CONFLICT OF INTEREST
The authors declare no conflict of interest, financial or otherwise.
ACKNOWLEDGEMENTS
Declared none.