All published articles of this journal are available on ScienceDirect.

Resilience, Psychological Characteristics, and Resting-state Brain Cortical Activity in Athletes and Non-athletes
Authors Info & Affiliations
Abstract
Background:
Athletes might build long-term resilience due to their need to adapt constantly to stressful situations. Further, physical activity is a powerful tool for stress-release, and controlling anxiety and depressive symptoms which might induce resilience by enhancing coping skills.
Objective:
This study aimed to compare the resilience, psychological characteristics, and the resting-state brain cortical activity of athletes and non-athletes. The secondary goal was to identify which variables could predict the resilience score.
Methods:
Ninety participants were divided into three groups, athlete (n=30), physically active (n=30) and sedentary (n=30), and asked to fill out the international physical activity questionnaire – short version (IPAQ), the resilience scale, the Beck depression inventory (BDI) and the trait and state anxiety inventory (STAI). Moreover, resting-state brain cortical activity was recorded by using an EEG to compute the standardized low-resolution brain electromagnetic tomography (sLORETA) analyses.
Results:
Significant differences between groups were observed in terms of resilience (X2=8.52; p=0.014) and physical activity level (X 2=76.07; p<0.001), with the athletes presenting higher values. Lower anxiety and depression, and higher physical activity levels were associated with higher resilience scores (R2=0.45; p=0.02). The results of sLORETA showed higher activity for sedentary individuals compared to athletes in frontal areas (Broadmann Area-BA 6, BA 8, BA 9), as well as when compared to physically active individuals in the superior frontal gyrus (BA 9). Additionally, physically active individuals presented less activity than athletes in the inferior occipital gyrus (BA 18).
Conclusion:
The results suggest that the physically active and athlete groups may have built a more resilient profile (compared to sedentary), have similar anxiety and depressive symptoms, and present a divergent resting-state brain cortical activity from the sedentary group, mainly in prefrontal areas. These findings suggest that regular physical activity and sports should be encouraged to aid in enhancing resilience and resting-state brain cortical function, and consequently, improving mental health.
1. INTRODUCTION
The chronic effect of moderate-intensity physical exercise, e.g. long-term participation, is often associated with the promo- tion and maintenance of physical and mental health [1, 2]. Regular exercise and long-term sports participation seem to play a similar role in developing some psychological and physiological characteristics [2] often observed in resilient people [3]. Moreover, enhanced coping skills and a resilient profile in physically active individuals have also been reported [4].
Resilience is known as the ability to successfully adapt to stress or adversity [3, 4]. In a sports setting, athletes need to adapt effectively to stressful situations, maintaining the flexibility of thought and optimism despite frequent losses, to stay motivated and persevere through adversity [5-8]. It is worth noting that athletes, throughout their lifespan, are repeatedly subjected to stressful situations, such as physical exertion and mental fatigue [5, 6]. Those situations might, in turn, prompt them to negative thoughts, low self-confidence, and high anxiety levels, compromising their athletic career and mental health [7]. Indeed, it was suggested that athletes manage stress and adversity to accomplish their goals, thus building resilience [6, 8]. Therefore, it is reasonable to speculate that not only the level of physical activity matters but also that the competitive sports environment might play a key role in building individual long-term resilience.
In the literature, there is growing evidence that resilience may be negatively correlated to anxiety and depressive symptoms [ 5 ]. While anxiety and depression can be triggers for several mental illnesses, resilience is known to act as protection against disorders [ 3 ]; additionally, exercise has been considered a powerful tool for stress-relief, as well as for controlling anxiety and depressive symptoms, and maintaining the quality of life [ 2 ]. Since athletes, physically active and sedentary individuals are differently engaged in sports training and exercise routines, observing distinct neuro-psychophysiological characteristics and resilient profiles would be expected. However, this hypothesis has not yet undergone full empirical examination. Despite this hypothesis, data in the literature have suggested that depression and anxiety-related psychiatric disorders appear to have similar rates between athletes and non-athletes. A possible explanation for this unexpected finding might be that this field of research is relatively new and professionals face the difficulty of diagnosing and distinguishing symptoms in the athlete population [ 9 ]. This might suggest that this issue should be examined further by taking into account the symptoms in combination with brain activity analyses.
At the cerebral level, exercise [ 10 ] and resilience [ 3 ] positively impact brain connectivity, synthesis and release of neurochemical substances [ 2, 3] and neural network activations (e.g., brainstem and limbic circuitry). Brain image techniques such as the functional magnetic resonance image (fMRI) are relatively high-cost measurements. Alternatively, the standardized low-resolution brain electromagnetic tomography (sLORETA) is a parallel method for detecting cortical activity changes in the resting-state condition. The electrical activity on the scalp provides brain activity maps corresponding to Brodmann areas (BA) [11]. Unfortunately, according to our current knowledge, there is a lack of studies that have investigated group comparisons [12]. The studies only assessed the acute effect of exercise, e.g. comparing brain activity before and right after exercise sessions. The results of these few investigations suggest that immediately after an aerobic exercise, there was an increased BA 23, 24, and 33 activity in young individuals [12] and in BA 7, BA 8 [13], and precuneus [14] activity in school children.
To the best of our knowledge, the present study is the first investigation conducted to assess resilience and psychological characteristics linked with resting-state brain cortical activity in athletes and non-athletes. Therefore, this study aimed to compare the resilience, psychological characteristics, and the resting-state brain cortical activity of athlete and non-athlete individuals. The secondary goal of the present study was to identify which variables could predict the resilience score. The investigated hypotheses of this study were: 1) The athlete group would present a more resilient profile and a greater percentage of individuals with high resilience classification, compared to non-athletes groups; 2) The sedentary group would have a lower resilience profile and more percentage of individuals with a lower resilience classification than the physically active and athlete groups; 3) The groups would have similar depressive and anxiety symptoms when they are considered mentally healthy individuals; 4) Since physical activity level, depressive and anxiety symptoms influence resilience in different ways, we expect these variables, when combined, to predict the resilience score; 5) Athletes and non-athletes would present different resting-state brain activity.
2. METHODS
2.1. Participants
Ninety participants (age 24.7±3.6 yrs; years of education 14.28 ±2.58) were recruited from the academic community of Federal University of Rio de Janeiro and Gama Filho University, local sports centers and from the navy. A researcher involved in the present study made a lecture explaining the research, purposes, and procedures for all potentially available individuals at the above-mentioned sites. Those who were interested in participating in this research scheduled a visit to the laboratory for data collection. The inclusion criteria were the following: the participants should be male aged between 18 and 30 years, literate and right-handed. Exclusion criteria consisted of the previous history of disabling physical and mental disease, individuals who had consumed alcohol in the last 24 h before the data collection, and individuals with reports of using psychotropic drugs or having neurological disease.
2.2. Groups
The participants were divided into athlete (n=30), physically active (n=30), and sedentary (n=30) groups. The athlete group composed of 15 combat sports athletes (judo and jiu-jitsu) and 15 endurance athletes (triathlon and pentathlon athletes), by convenience sampling. The criteria to participate in each group were: for athlete group, participants should be involved in national or international competitions of their respective sport. All athletes were required to have at least four years of training in their sport, with a minimum of 8 weekly training hours and not scheduled any official competition for the next one month from the data collection. Physically active group: individuals who reported regular practice in any sport (non-competitive) or physical exercise for at least two consecu- tive months before the study interview. The participants also had to be classified as physically active in agreement with the International Physical Activity Questionnaire (IPAQ - short version) [15]. Sedentary group: individuals who reported not being involved in any regular sports, exercise practice, or physical activity. These participants could not have been classified as physically active in accordance with the standards and cut-offs indicated by the short version of the IPAQ [15]. All participants fulfilled the IPAQ-short version.
2.3. Procedures
The participants received previous indications to follow on the evaluation day, such as they could not perform any kind of physical exercise, physical activity or sport; they could not ingest stimulant food and drink (e.g. coffee and chocolate); they were asked to make an attempt to maintain their standard sleep routine and eat regularly. For the data collection, the same researcher explained in detail the directions of each applied questionnaire and conducted all test procedures. Each participant was informed about the experimental procedures and signed the written consent form for participation in the study. Then, the participant fulfilled a brief anamnesis, the short version of the international physical activity questionnaire (IPAQ), the Beck depression inventory (BDI), and the trait and state anxiety inventory (STAI), to assess resilience and psychological characteristics. Furthermore, an electroencephalogram (EEG) exam was recorded with the purpose to assess the resting-state brain cortical activity through sLORETA analyses. The participant was seated in a relaxed and comfortable position for at least 8 min, in a room with sound and light attenuated, with his eyes closed in an alert/resting-state while the brain cortical activity was recorded. Each participant spent an average of 2 h in the laboratory for the data collection, and the full data collection for this study lasted for three months. The research procedures were approved by the Gama Filho University Research Ethics Committee (0126.2010) and followed Resolution 466/12 from the Brazilian Ministry of Health.
2.4. Questionnaires, Scales and Inventories
2.4.1. International Physical Activity Questionnaire – short version (IPAQ - short) [ 15, 16]
The IPAQ scores were used to distinguish physically active from sedentary individuals. The IPAQ estimates the level of weekly physical activity. The IPAQ- short version values were transformed in the metabolic equivalent of task (MET) min spent per week (MET-min/week) [15, 16]. The adopted values for group division were sedentary (≤600 MET-min / week) and physically active (≥601 to 1500 min-MET / week). Although the inclusion criteria for the athlete group did not consider the IPAQ values, all athletes completed the IPAQ- short version for sample description purposes.
2.4.2. Resilience Scale [17]
The Brazilian version of the resilience scale was adopted to measure factors related to positive psychosocial adaptation in the face of major life events. Higher scores indicate a potential for a greater resilient profile. Moreover, low resilience classification scores range from 25 to 130, medium resilience classification scores from 131 to 160, and high resilience classification scores range from 161 to 175.
2.4.3. Beck Depression Inventory (BDI) [18]
The BDI was used to assess depressive symptoms that may be present in the individuals over the past week, including the day of the assessment. The greater the intensity of the symp- tom/attitude, the higher the score in the BDI. Due to the obtained scores, participants are classified as being asympto- matic (0-13), presenting low depressive symptoms (14-19), moderate depressive symptoms (20-28), and severe depressive symptoms (29-63).
2.4.4. Trait and State Anxiety Inventory (STAI) [19]
To evaluate subjective components related to anxiety, the STAI was adopted. The STAI is a self-reported questionnaire that consists of trait anxiety (STAI-T) evaluation (assesses the participants' personality) and state anxiety (STAI-S) which consider the participant’s current symptoms of anxiety. The total score of the instrument ranges from 20 (lowest) to 80 (highest). In accordance with the obtained values in the STAI (STAI-T and STAI-S, separately), the individual is characterized by presenting a low (20-30), medium (31-49), or high anxiety (50-80).
2.5. Resting-state Brain Cortical Activity
2.5.1. EEG Exam (Recording and Acquisition)
The 10/20 international EEG System for electrode placement on the scalp was used. EEG data were collected from the 20 monopolar electrodes sites (Fz, Cz, Pz, Oz, Fp1, Fp2, F3, F4, F7, F8, C3, C4, T3, T4, T5, T6, P3, P4, O1, and O2) (Braintech-3000, EMSA-Medical Instruments, Brazil) and the impedances for EEG electrodes were below 5kΩ.
2.5.2. EEG Data Analysis
From the EEG exam, the artifacts as blinks and eyes muscular voluntary movements were detected and eliminated by visual inspection [ 20 ]. An EEGLAB tool named independent component artifact was applied, aiming to remove other possible artifact sources. Amplifier band-pass was 0.5-100 Hz (3dB points), and a 60-Hz notch filter was employed, and data were digitized at 240 Hz with 12-bit resolution. Finally, at least 2 min data free from artifact were acquired from the EEG for the quantitative analyses of resting-state brain cortical activity.
For performing the spectral analysis of the EEG acquired exam free from an artifact, the MATLAB® 5.3 (The Mathworks Inc., Natick, Mass., USA) was used. A classic power spectral density estimator was performed with fast Fourier transform in a rectangular windowing. For each of the 20 monopolar derivations, absolute power (μV2) was computed for the alpha (8-12 Hz) frequency band. Alpha power was log-transformed (i.e., X’=lognX) to provide a more normal distribution, acquiring Gaussianity.
2.5.3. sLORETA – Standardized Low-resolution Brain Electromagnetic Tomography
sLORETA is a method/program to address the limited spatial resolution of the EEG and to permit a 3-dimensional tomography of electrical brain activity [11]. Through mathematical calculations, the sLORETA allows the identification of the sites of the brain activity EEG, providing results of group comparison related to BA and brain waves/frequency bands. Thus, sLORETA images represent the standardized electric activity at each voxel in neuroanatomic Montreal Neurological Institute (MNI) space as the exact magnitude of the estimated current density. Anatomical labels as BA are also reported using MNI space, with the correction to Talairach space. The intracerebral volume is partitioned in 6,239 voxels at a 5 mm spatial resolution. A minimum of 120 sec of artifact-free resting-state EEG on 2-sec epochs was exported for further analyses using the sLORETA software provided by the KEY Institute for Brain-Mind Research (University Hospital of Psychiatry, Zurich, Switzerland; http://www.uzh.ch/Keyinst/NewLORETA/LORTA01.htm). Next, data were log-transformed and calculated in delta (0-3.9Hz), theta (4-7.9Hz), alpha (8-12.9Hz), beta1 (13-17.9Hz), and beta2 (>18Hz) activity for each participant in each group. Using the sLORETA transformation matrix, cross spectra of each participant and for each frequency band were transformed to sLORETA files.
2.6. Statistical Analyses
Data of a previous cross-sectional study regarding the resilience scale and sport of former athletes [5] was used to calculate the total sample size in this study. The total sample size of 27 individuals was found from the calculation, however, all of the participants that attended the previous invitation were considered (n = 30) regarding possible sample losses. Gaussianity and homoscedasticity tests were applied for the resilience, IPAQ, STAI and BDI score variables. Kruskal Wallis test (with Tamhane post hoc) was applied, instead of ANOVA, since these data did not show a normal distribution. As a categorical variable, the Crosstabs test was adopted for the resilience categories (within and between) comparison.
To identify the variables (assessed by IPAQ, STAI and BDI) that could be associated with the resilience score, a linear stepwise regression was performed. Since the outputs of sLORETA do not provide central-tendency measures, there is no available way to include the sLORETA in the regression model to predict resilience in this study.
sLORETA – The program only runs independent t-test to compare the divergence between groups. After a critical threshold was defined (tcritical), voxels with statistical values exceeding this threshold were accepted. The omnibus hypothesis (that all the voxel hypotheses are true) was rejected if a voxel value exceeded the critical threshold for p<0.05 defined by 5000 randomizations. Voxel-by-voxel t values in Talairach space were displayed as Statistical Parametric Maps (SPMs).
Except for EEG data, all analyses were performed using the SPSS® software package, version 22.0 (SPSS Inc., Chicago, IL, USA). The accepted significance level in this study was p≤0.05.
3. RESULTS
There was no significant difference of age (X2=0.122; p=0.942) and years of education (X2=1.556; p=0.459) between groups. The age and years of education were [mean (SD)]: 24 (6.2) and, 12 (5) for sedentary; 24 (3) and 12 (4) for physically active; 24 (6) and 14 (4) for athlete group, respectively.
Considering the physical activity level, as expected, the MET-min/week exhibited statistically significant differences between groups ( Table 1 ). The post hoc analysis revealed that the sedentary group was less physically active than physically active (p<0.001) and athlete groups (p<0.001). Besides, the physically active group was less physically active than the athlete group (p<0.001). Indeed, the athlete presented higher scores (8640 MET-min/week) compared to both, physically active (1677 MET-min/week) and sedentary (99 MET-min/week) groups.
3.1. Resilience Results
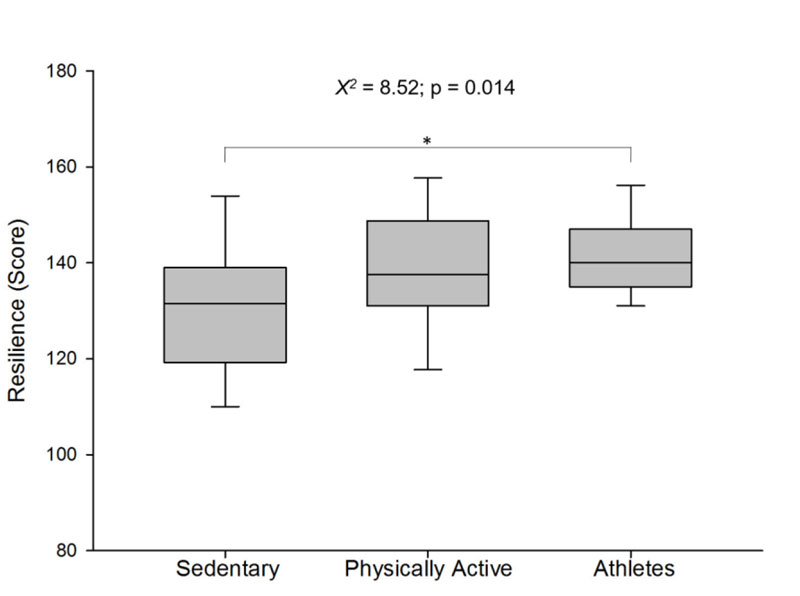
The resilience score presented significant differences between groups (X2 = 8.52; p = 0.014; Fig. 1). Corroborating the hypotheses of the present study, the post hoc analysis showed a higher resilience score for the athlete group compared to the sedentary group (p=0.019). However, there was no significant difference between the athlete and physically active groups (p=0.729) and between sedentary and physically active groups (p=0.220). The raw resilience score of groups was [median (interquartile range)]: 131 (19) for sedentary, 138 (17) for physically active and 140 (12) for athlete group.
|
Sedentary (n=30) |
Active (n=30) |
Athlete (n=30) |
X2 | p-value | |
|---|---|---|---|---|---|
| BDI (Score) | 4 (6.5) | 3 (4.2) | 3 (4) | 1.784 | 0.410 |
| STAI T (Score) | 33 (10.2) | 30 (8) | 35 (12) | 3.855 | 0.145 |
| STAI S (Score) | 36 (14.5) | 31 (8) | 34 (10.5) | 2.126 | 0.345 |
| MET (min/week) | 99 (252) | 1677.5 (1620) | 8640 (2067.2) | 76.071 | 0.001*¥ |
| Resilience between groups | |||||
| Low | 68.2% | 22.7% | 9.1% | 16.725 | 0.001* |
| Medium | 20.3% | 39.1% | 40.6% | 16.963 | 0.001* |
| High | 50% | 0% | 50% | 2.093 | 0.351 |
| Resilience within group | |||||
| Low | 50% | 16.7% | 6.7% | ||
| Medium | 43.3% | 83.3% | 86.7% | ||
| High | 6.7% | 0% | 6.7% | ||
| X2 | 9.8 | 13.333 | 38.400 | ||
| p-value | 0.007# | 0.001# | 0.001# | ||
The relative distribution of resilience classification score (low, medium, high) between groups and within the group is presented in Table 1 . No significant difference between groups for the high resilience classification (ranged 161-175 score) was found ( X2 =2.093; p=0.351). However, the relative distribution for the low resilience classification (ranged 25-130 score) showed a significant higher percentage for the sedentary group (68.2%) when compared to physically active (22.7%) and athlete (9.1%) groups. Moreover, the relative distribution of medium resilience classification (ranged 131-160 score) between groups showed significantly higher percentages for the physically active (39.1%) and the athlete (40.6%) groups when compared to the sedentary group (20.3%).
The relative distribution of resilience classification score (low, medium, high) within group (Table 1 ) showed statistically significant differences for all three groups. Given support to our hypothesis, 50% of individuals in the sedentary group presented low resilience classification score (X2=9.800; p=0.007); while 83.3% of individuals in the physically active group (X2=13.333; p<0.001) and 86.7% of individuals in the athlete group (X2=38.400; p<0.001) had a higher percentage of medium resilience classification score.
3.2. Psychological Characteristics Results (Depression and Anxiety Symptoms)
The psychological characteristics (depression and anxiety symptoms) scores are presented in Table 1 . Supporting our hypothesis, there was no significant difference for the depressive (BDI) and anxiety symptoms (STAI T and STAI S) results between groups.
3.3 Association between variables to predict resilience
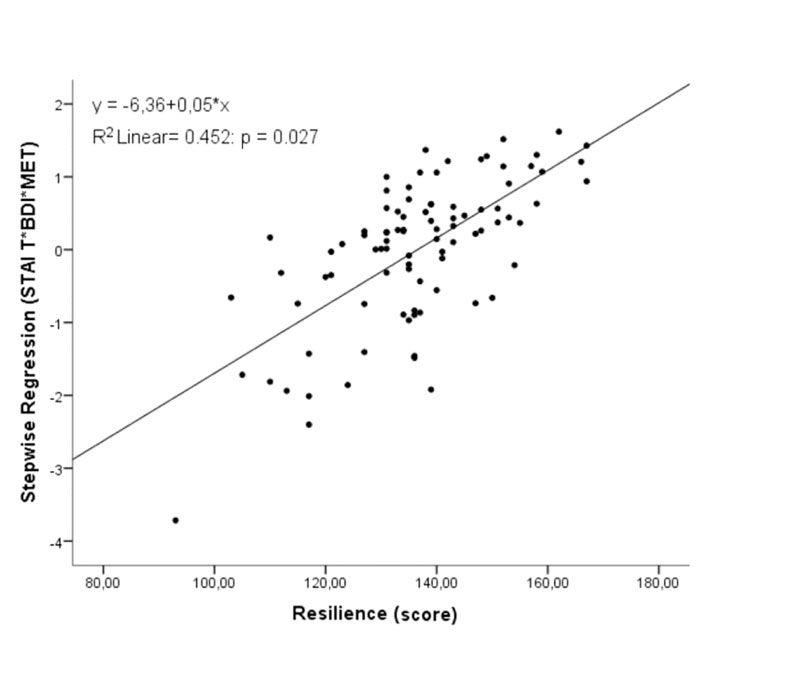
The results of the regression analysis demonstrated a greater association with resilience when STAI T, BDI and MET were evaluated together. The statistics did not show multicollinearity among variables. The main model showed a significant relationship for resilience (r=0.673; R2=0.45; r2 change=0.032; p=0.027; Fig. 2). The STAI-S was the only variable not considered significant in the stepwise regression model analysis. The values related to each variable of this stepwise regression are presented in Table 2, showing lower anxiety and depressive symptoms as the higher the physical activity levels were, the greater the resilience score was.
3.4 Resting-state Brain Cortical Activity Results
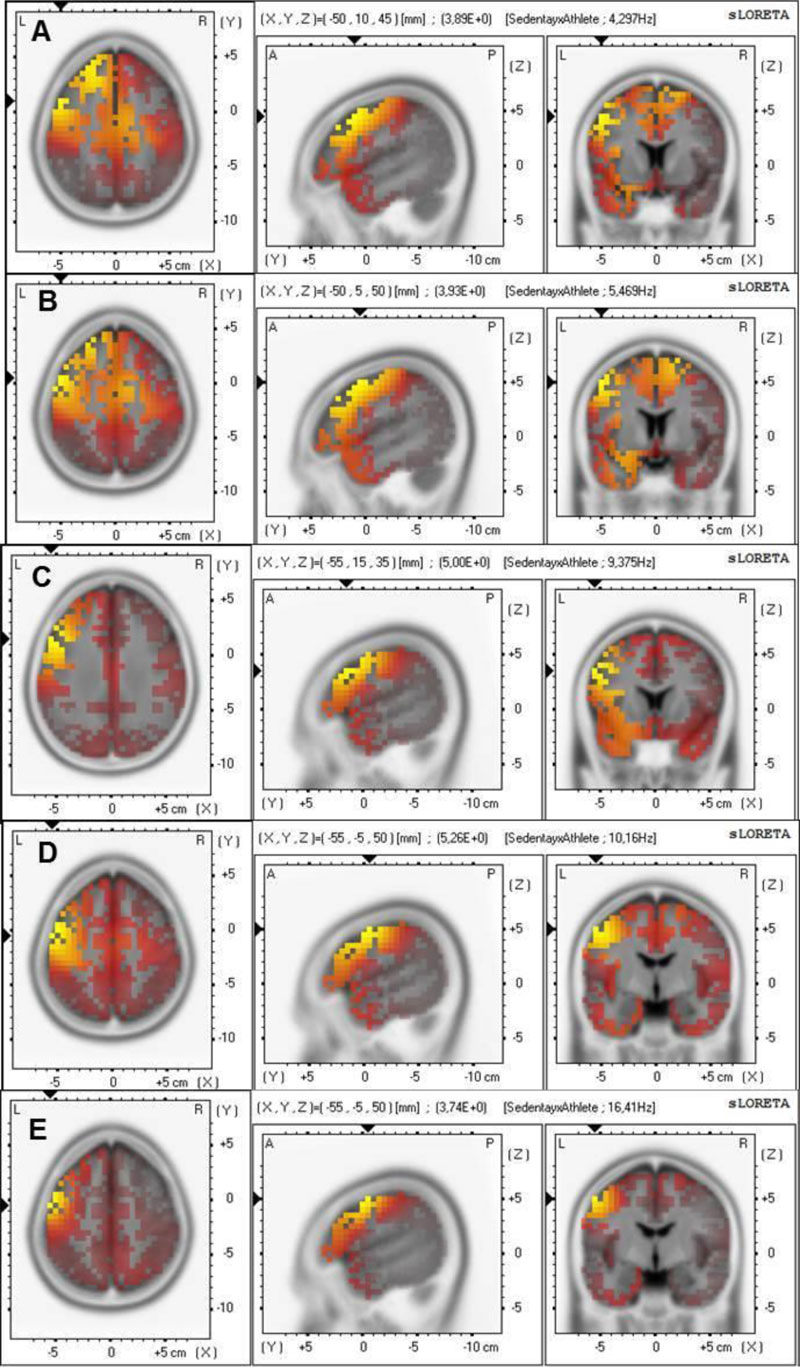
The sLORETA results showed a higher activity for the sedentary group compared to the athlete group (Fig. 3). Statistically significant differences were observed (tcritical0.05=3.736), revealing higher theta (t=3.894; BA 8; Fig. 3A and t=3.933, BA 8; Fig. 3B) and alpha bands in the middle frontal gyrus (t=4.996; BA 9; Fig. 3C). Moreover, alpha (t=5.256; BA 6; Fig. 3D) and beta1 bands in the precentral gyrus of the frontal lobe (t=3.740; BA 6–Fig. 3E) were higher for the sedentary than the athlete group.
| Model | B | Standard Error | Beta | t | p |
|---|---|---|---|---|---|
| Constant | 160.710 | 5.948 | 27.020 | 0.000 | |
| STAI T | -0.626 | 0.185 | -0.368 | -3.380 | 0.001* |
| BDI | -1.010 | 0.355 | -0.309 | -2.843 | 0.006* |
| MET (min/week) | 0.001 | 0.000 | 0.181 | 2.248 | 0.027* |
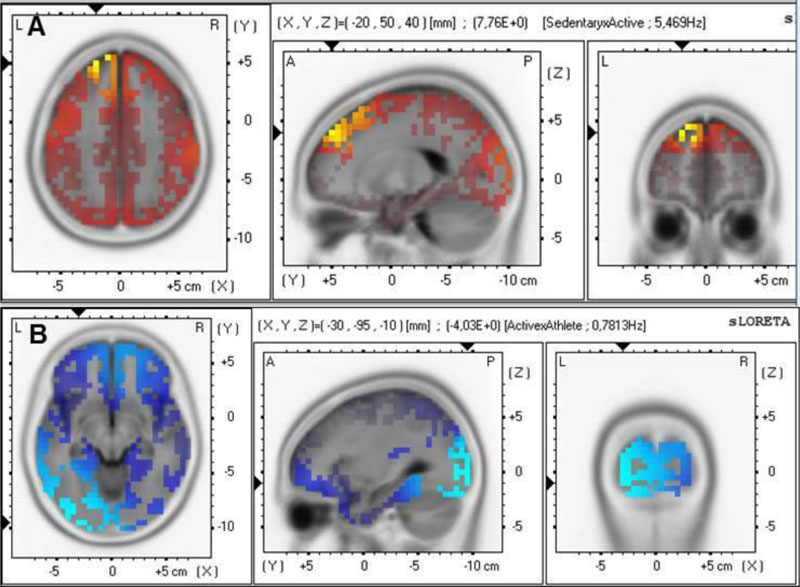
The sLORETA analyses showed a statistically significant difference between sedentary and physically active groups (Fig. 4A). The sedentary group presented higher theta activity in the superior frontal gyrus (BA 9) (t=7.762 for tcritical0.05=7.021– Fig. 4A). In Fig. (4B), the sLORETA analysis comparison between physically active and athlete groups presented lower delta in the inferior occipital gyrus (tcritical0.05=3.873; t=4.033, BA 18-Fig. 4B) for the athlete group.
4. DISCUSSION
This study aimed to compare resilience, psychological characteristics, and the resting-state brain cortical activity of athletes and non-athletes. The main finding of the present study was that athletes presented higher resilience scores compared to the sedentary group, corroborating the hypothesis of the study. Furthermore, the results showed that the sedentary group had more percentage of individuals classified with a low resilience score, while the physically active and athlete groups had more percentage of individuals classified with medium resilience score. However, the psychological characteristics (depressive and anxiety symptoms) were not different between the groups. Despite these results, findings from regression analysis showed that a combination of mild depressive and anxiety symptoms and a high physical activity level contributed to greater resilience. Finally, a unique and novel finding in the present study showed that the sedentary group presented higher resting-state brain cortical activity on prefrontal cortex areas compared to the physically active and athlete groups; moreover, the physically active group presented lower resting-state brain cortical activity in the occipital cortex than the athlete group.
The higher resilience scores for athletes corroborate our first hypothesis. This result suggests that the sports environment might aid in building a resilient profile, perhaps, due to the long-term development of coping mechanisms. Athletes may develop strategies to deal with changes in their environment, such as losses, stressful situations related to sports, and in non-sports settings. Data from the present study reinforces the findings suggesting that the resilient profile in the athletes may be built throughout their sports careers [4-6, 8]. Moreover, studies have also demonstrated that athletes with enhanced resilient profiles create coping strategies in favor of sports performance. These strategies may aid them in obtaining health benefits [6, 8]. Also, it has been reported that athletes of team-sports usually adopt strategies in order to withstand stressors for optimizing performance and consequently building resilience [8]. Furthermore, resilience could have a protective effect on the athletes’ mental health.
Another interesting finding in the present study was that not only the sports environment but also the physical activity level has an influence on the resilience score. Our second hypothesis of sedentary individuals having a less resilient profile (with more individuals having low resilience classification) than physically active individuals was partially corroborated. Meaning that, even though sedentary and physically active groups did not statistically differ in their resilient profile, they showed significant differences in the resilience classification. A higher percentage of sedentary individuals with low resilience classification was observed when compared to the physically active and athlete groups.
One possible explanation for this result might be associated with some psychological and physiological mechanisms related to regular exercise. Long-term exercise is known to induce changes in psychological (self-esteem, well-being, and self-confidence) and physiological (release of neurotransmitters and limbic circuits involved in promoting neurogenesis) mechanisms which could protect individuals from developing several possible mental illnesses [2]. Many neuropsychological hypotheses were formulated to explain what happens in a resilient person. Among them, mechanisms involving neuropeptide Y, neurotrophic factors, and dopaminergic system activation could be cited. In short, the neuropeptide Y would minimize stress perception, the neurotrophic factors would activate cognitive brain areas rather than emotional ones when performing tasks [3], and sports/exercise would induce reward-based effort systems [2, 10]. All of these effects (less stress, more cognitive brain areas activated, and improvement of the reward system) could indirectly contribute to building a resilient profile [3, 6-8]. Furthermore, it is worth mentioning that most physical and mental assumptions are genetically influenced, such as several genes (related to the transportation of serotonin, NPY, and BDNF), transcriptional and epigenetic mechanisms (interaction with environment and lifestyle) might exist in a resilient person [3]. Overall, these mechanisms might aid in explaining the results of the present study, while the present data provide evidence of differences in resilience between active and sedentary individuals, contributing to the literature concerning this issue.
Despite the results from the resilience score and physical activity level, we did not observe differences between the groups in terms of depressive and anxiety symptoms, as expected, which were assumed in the present study as psychological characteristics. It is important to highlight that data from the literature have also shown that anxiety, depressive symptoms, and mental disorders may occur at similar rates in athletes and non-athletes [9]. A cross-sectional study [5] showed higher resilience for former athletes compared to non-athletes, but negative correlations between resilience scores and anxiety (state and trait) symptoms were observed when all individuals were evaluated together (former athletes and non-athletes). This means that healthy individuals, regardless of their physical activity level, might have a close modulation in anxiety symptoms and their resilience profile. These results, together with the present study, indicate that healthy individuals may have a modulation between psychological characteristics (anxiety and depression symptoms) and the resilient profile.
To identify which variables would be more likely to predict resilience, a regression analysis was conducted. Following our fourth hypothesis, the result suggests that a combination of lower anxiety and depressive symptoms with elevated physical activity level would positively affect and consequently could be a good predictor of the resilient profile. This result confirms previous data from the literature indicating the need for psychological control and physical exercise as additional practice for maintaining mental health [2]. On the other hand, the influence of physical stimulus, as physical stress, on resilience should not be neglected. For instance, when the stress is greater than the ability to adapt, it might induce diseases and dysfunction. The neurophysiological explanations for the effects of stress and exercise on mental health are dose-dependent. For example, the acute effect of physical exercise induces cortisol releases (stress hormone) through the hypothalamus-pituitary-adrenal (HPA) axis; meanwhile, its chronic effect induces adaptations on the HPA axis, improving mental health [2]. Considering our cross-sectional study design and looking closer at our data, one could wonder if the included athletes were in this overstress situation, affecting their brain centers’ modulation.
Neurobiological changes (i.e., neuroplasticity, synaptogenesis, neurogenesis) [2] and certain brain areas (i.e., prefrontal cortex, hippocampus, anterior cingulate cortex) [10] are modulated by the long-term exercise. These effects on brain circuitry might modulate brain activity at the resting-state condition. In this sense, our hypothesis of athletes and non-athletes presenting different resting-state brain activity was confirmed. Regarding the resting-state brain cortical activity results, the sedentary group showed higher activity than both, athletes in different frontal areas (BA 6, BA 8, BA 9), and physically active individuals in the superior frontal gyrus (BA 9). Additionally, the physically active group showed lower activity than the athlete group in the inferior occipital gyrus (BA 18). These results are aligned with some previous studies that used different designs and distinct samples, and therefore, provided the literature with important and unique information. For example, a previous study reported that expert cognitive-motor performers have greater neural efficiency in the bilateral dorsomedial prefrontal cortex (BA 8 and 9) compared to controls [21]. Even though this investigation was conducted during a performed task, and with a different brain evaluation technique than that used herein, it is possible to assume that the results from both studies are complementary. A previous study using the same sLORETA analysis showed increased activity on BA 18 after 15 minutes of exhaustive treadmill exercise for recreational runners [13]. This study emphasizes the sLORETA as a robust method to generate brain activity maps from EEG recordings with consistent findings related to the participants’ alterations in emotional processing. Considering that in the current results, the brain activity was primarily located in the prefrontal cortex areas which might suggest that athletes and physically active individuals possess a more optimized executive function and present better emotional control management than sedentary individuals. This is likely associated with their long-term psychological and brain adaptations. This hypothesis is speculative, but future studies could be conducted to test it while contributing to advancing knowledge in this area. Indeed, the resting-state brain activity differences between athletes and non-athletes related to function are still unknown; such approach warrants investigation.
Another possible explanation for the present results demonstrating higher resting-state brain activity for the sedentary group compared to the physically active and athlete groups might be the default mode network (DMN). The DMN leads to the hypothesis that some cerebral areas, such as prefrontal (ventromedial, dorsomedial, posterior of anterior cingulate), parietal (medial and lateral), and precuneus, have higher functional connectivity among them at rest than other brain areas [22]. The DMN seems to be a genetic phenotype serving as a biomarker of health. Previous studies found the DMN positively correlated with cognitive function [22] and negatively correlated with the theta [23] and alpha EEG band [24]. Thus, considering the EEG wave band results in the present study showing higher frontal theta and alpha activity in the DMN brain areas of the sedentary group when compared to the physically active and athlete groups, these could indicate decreased DMN activity for the sedentary group. A systematic review showed that physically active individuals (engaged at least for three months in an exercise program) had increased functional connectivity in the DMN areas when compared with their paired-matches [10]. As such, the resting-state brain cortical activity results of the present study might represent a beneficial effect of sports or exercise on cortical connection efficiency and plasticity for the physically active and athlete groups when compared to the sedentary group in resting-state condition.
Moreover, many fMRI studies have investigated the association between resilience and brain function connections [25, 26]. The authors suggest that the DMN is an indicator for the presence of neural mechanisms that may promote resilience [25-27], or at least delay illness onset [26]. Particularly in resilience scale measurements, one study on young adults found stronger DMN function connectivity in highly resilient individuals [27]. Therefore, the current results on resilience and brain activity could suggest that regular physical activity or the long-term involvement in sports may be related to mental health and certain healthy brain patterns. People who are physically active would benefit not only from building a resilient profile and managing anxiety and depressive symptoms but also might have better-connected and functional resting-state brain activity compared to sedentary individuals.
4.1. Strengths & Limitations
One in four people around the world is affected by some type of mental disorder [1] and the search for strategies to improve the population's mental health is a general concern in the psychiatry and psychology fields. Therefore, studies on resilience in sports or exercise should be conducted and their results should be highlighted since exercise may be a contributing factor for building resilience [4, 5, 8]. The investigation of behavioral and neurophysiological characteristics of athletes and non-athletes related to mental health is a wide and underdeveloped field of research. In our study, the assessed sample had their different physical activity levels strictly controlled, they did not differ in anxiety and depressive symptoms and we even found a more resilient profile for those who were physically active. On the other hand, the cross-sectional design of our study does not allow us to infer a cause-effect relationship, we could not directly assess the participants' physical conditioning level and their resilient profile. The EEG data acquisition with 20 channels might not provide the exact source location with zero errors as the sLORETA program affirms and since two participants (2.2% of total) were under the age of 20, their completed development (muscle and nervous system) might introduce a bias. Further studies should investigate different periods in the sports season and periods throughout an athlete's life. These studies could include other psychological assessments and cortical activity assessment measurements that can investigate subcortical regions of the DMN, not studied here.
CONCLUSION
In summary, our results indicate that the physically active and athlete groups build a more resilient profile, have similar anxiety and depressive symptoms, and present divergent resting-state brain cortical activity than the sedentary group, mainly in prefrontal areas. Moreover, low anxiety and depressive symptoms together with high physical activity levels predict a greater resilient profile. Based on the present results, it seems prudent to recommend and encourage regular participation in physical activity and sports to enhance resilience and resting-state brain cortical functioning, consequently improving mental health.
ETHICS APPROVAL AND CONSENT TO PARTICIPATE
The research procedures were approved by the Gama Filho University Research Ethics Committee (0126.2010) and followed Resolution 466/12 from the Brazilian Ministry of Health Brazil.
HUMAN AND ANIMAL RIGHTS
Not applicable.
CONSENT FOR PUBLICATION
All patients participated on a voluntary basis and gave their informed consent.
AVAILABILITY OF DATA AND MATERIALS
Not applicable.
FUNDING
This study was supported in part by the Coordenação de Aperfeiçoamento de Pessoal de Nível Superior - Brasil (CAPES) - Finance Code 001 and by PDSE (88881.190582/ 2018-01), Brasil - CAPES (88882.450525/2019.1), Conselho Nacional de Desenvolvimento Científico e Tecnológico under Grant (CNPq-303474/2019-0); Fundação Carlos Chagas Filho de Amparo à Pesquisa do Estado do Rio de Janeiro (FAPERJ-E26/202.523/2019).
CONFLICT OF INTEREST
The authors declare no conflict of interest, financial or otherwise.
ACKNOWLEDGEMENTS
Declared none.