All published articles of this journal are available on ScienceDirect.

A Systematic Review for Stand-up Paddle
Authors Info & Affiliations
Abstract
Background:
The goal is to investigate how the length and height of passes impact a team's performance in national championships. A predictive model will be developed to analyse the success of different pass characteristics, including short, medium, and long length and ground, low, and high height. The model will be based on the points earned and will determine which combination of pass characteristics is most effective.
Objective:
Therefore, this systematic review aims to identify and synthesize the external and internal parameters commonly used to evaluate SUP performance under different test conditions.
Methods:
The search was conducted in multiple scientific databases (Google Scholar, MEDLINE/(PubMed), Science Direct, and Web of Science) and was completed on January 31, 2022, using the following keywords: “stand up paddle,” “stand up paddling”, and “stand up paddle boarding.”
Results:
Twenty-one articles were selected, involving a total of 238 subjects at both the competitive and recreational levels. SUP athletes have increased muscle mass, decreased body fat percentage, and used more efficient paddling techniques, highlighting the importance of equipment evaluation in improving athletic performance.
Conclusion:
More research is needed to improve the performance and expand the culture of SUP. The integration of specific technologies can help to understand better the variables that affect performance outcomes.
1. INTRODUCTION
The activity of standing up to paddle has been developed in various regions of the world, including South America and Africa. Stand-Up Paddle (SUP), which originated in Hawaii and is also called Hoe he'e nalu, involves standing, paddling, and surfing waves [1]. SUP gained popularity in the early 2000s when professional surfers began using it to maintain their physical fitness and surfing skills while in the ocean [2]. SUP combines elements of rowing and surfing, allowing practitioners to travel certain distances and/or surf waves [3] on boards that are longer, thicker, and wider than traditional surfboards. These features provide better buoyancy, stability, and increased stroke power [4].
Over the past decade, SUP has become the fastest-growing aquatic sport in the world, both as a recreational activity and as a competitive sport [5-7]. In the United States alone, the number of SUP participants increased from 1.1 million in 2010 to 2.8 million in 2014 [8], with an additional 26% increase between 2012 and 2015. In 2011, 1.2 million people tried SUP for the first time [8], reflecting an 18% increase from the previous year [9]. Notably, in 2013, SUP had its highest number of first-time participants in the USA. This increasing popularity of the sport has been attributed to its accessible learning curve and multiple physiological and psychological benefits [7, 10, 11]. A recent systematic review [12] provided an overview of the benefits of SUP and confirmed its potential to improve cardiorespiratory fitness, health, and education-related parameters.
However, despite its global appeal, there is currently limited scientific literature available on the performance aspects of SUP [13]. The concept of performance is multidimensional and encompasses the ability to successfully complete a task in a given context, which may be influenced by various physiological capacities such as endurance, strength, speed, or flexibility [14, 15]. Due to its complex and multifaceted nature, some authors argue that a single definition cannot fully capture the concept of performance [16].
When analyzing individual sports, it is critical to emphasize the technical execution of movements, as well as the biomechanical and physiological variables that are essential to provide essential data for adaptive interventions in training and competition, as well as to describe technical performance [17]. In the context of SUP, it is recognized that performance and success are influenced by a variety of factors. As a result, there is a need for greater precision in the variables that can describe the activity and behavior of athletes and practitioners, which is essential for practical interventions and the development of the sport. Through scientific and technical methods and applications of analysis, a deeper understanding of SUP performance outcomes can be achieved. Therefore, this systematic review aims to identify and synthesize the external and internal parameters commonly used to evaluate SUP performance.
2. MATERIAL AND METHODS
The purpose of this study is to summarize the findings and conclusions reported in the literature regarding the performance analysis in SUP using a systematic review that includes practitioners with varying levels of experience. A comprehensive bibliographic search was conducted to identify articles published on this topic. Based on the inclusion and exclusion criteria, some articles were excluded, while others were included in this systematic review.
A comprehensive search of Google Scholar, MEDLINE/(PubMed), Science Direct, and Web of Science databases was performed. The search terms (“stand-up paddle”, “stand up paddling”, “stand-up paddle boarding”, and “SUP”) were used across all fields. There were no restrictions regarding the duration of the study. Articles published in these databases from January 1, 1990, to January 31, 2023, were included.
In terms of inclusion and exclusion procedures, the studies included in this analysis focused on four primary themes. The first was cross-sectional interventions, which are interventions that occur at a single point in time without continuity over time. The second theme includes non-cross-sectional interventions, which have a longer duration and involve continuity over time. The third theme relates to performance outcomes on various SUP tests conducted in the laboratory or in the field. The final theme includes studies in which the participants were healthy individuals without exercise limitations, aged 18 years or older.
Exclusion criteria included dissertations, abstracts and conference proceedings, literature reviews, articles for which the full text was not available, articles not available in English, and articles not published in a peer-reviewed journal.
Studies were included for further analysis if they assessed at least one parameter related to SUP performance. The evidence extracted from the selected studies was based on the research design, objectives, subjects, conditions, equipment, procedures/outcomes, and findings.
The assessment of the methodological characteristics of the studies included in this review was carried out by two independent reviewers according to the protocols of the Cochrane Collaboration [18]. In cases of disagreement between the reviewers, a third author was appointed to resolve the disagreement. Each included study was assessed for the following dimensions: random sequence generation and allocation concealment (selection bias), blinding of participants and personnel (performance bias), blinding of outcome assessors (detection bias), incomplete outcome data (attrition bias), selective reporting of outcomes (reporting bias), and other sources of bias [19]. For each dimension, the assessment was categorized as “high risk,” “low risk” or “unclear risk.” If a clear judgment could not be made due to ambiguity, insufficient clarification, or uncertainty about potential bias, an “unclear risk” designation was assigned.
The search was conducted according to the PRISMA (Preferred Reporting Items for Systematic Reviews and Meta-Analyses) guidelines [20]. The main outcomes of the studies were identified. Relevant data were extracted and categorized. Data included authors/year, aim, research question, participants, outcomes, and findings. Each of these elements was systematically organized and analyzed independently using Microsoft Excel 2016 software (Microsoft, Redmond, WA, USA).
3. RESULTS
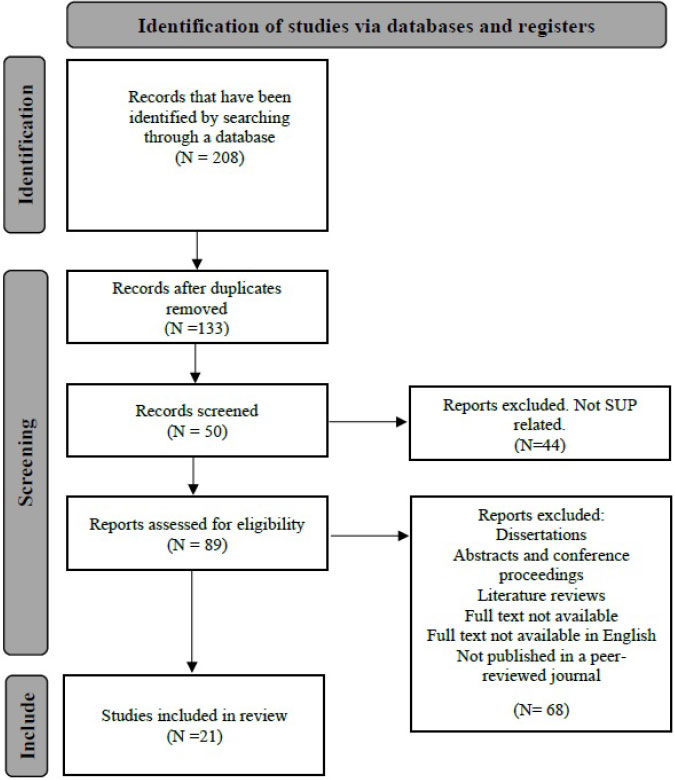
Fig. (1) illustrates the flowchart of the screening process. Initially, the literature search identified a total of 208 articles related to the selected descriptors. However, only 21 studies met all the inclusion criteria and were included in the systematic review. The elimination process included 75 duplicate articles, and 44 studies were excluded based on their titles or abstracts from the remaining 133 articles. After careful assessment of 89 studies for eligibility, 68 studies were excluded because they were classified as dissertations, conference proceedings, or because the full text was not available on the topic in question. Consequently, the present systematic review includes 21 studies that successfully met the inclusion criteria.
In the analyzed studies, from different fields such as anthropometry, biomechanics, and physiology, a total of 238 individuals were involved in different exercise protocols performed at different intensities, with different equipment and in different settings. Some studies focused on one gender only, such as [4, 11, 13, 21], while others included both genders, such as [7, 10, 11, 22-26]. The technical or performance level varied across studies, including inexperienced participants [11], exclusive practitioners [6, 24, 26], competitive/elite participants [7, 13, 22, 23, 27-29], and a combination of technical levels [24]. The characteristics of the studies are summarized in Table 1.
Table 1.
| Authors/Year | Títle | Area/s | Aim | Participants |
| Castañeda-Babarro et al., 2020a [13] | Anthropometric profile, body composition, and somatotype in stand-up paddle (SUP) boarding international athletes: a cross-sectional study | Anthropometry | Describe the anthropometric profile of SUP boarders. | N = 31, males, age, 34.2 ± 12.4 years. |
| Ost et al., 2017 [25] | Improvement of Balance Stability in Older Individuals by On-Water Training | Biomechanics | Evaluate the effect of SUP practice on upright postural control in older individuals. | N = 16, 9 females, 7 males, 61.68 ± 1.25 years. |
| Chen et al., 2018 [52] | Stability of coupled human and stand-up paddle board | Biomechanics | Investigate the stability of a stand-up paddleboard. | The system of a rider standing on an SUP is modeled. |
| Dyer, 2018 [50] | A Proposed Field Assessment Method for Stand up Paddle Board Technology | Biomechanics | Evaluate the intra-test reliability of an outdoor field assessment methodology, and the impact of three different levels of SUP technology on the assessment results. | SUP equipment test. |
| Schram et al., 2014 [29] | Profiling elite Stand-Up Paddle boarders | Biomechanics Anthropometry |
Investigate valid and reliable outcome measures for assessing static and dynamic balance and assess the trunk musculature strength of SUP elite and compared to population mean values. | N=8, 3 females and 5 males, 36.8 ± 6.3 years, and 4.1 ± 2.2 experience years. |
| Schram et al., 2019 [24] | A biomechanical analysis of the stand-up paddle board stroke: a comparative study | Biomechanics | Comparison between experienced and inexperienced participants in paddle stroke kinematics. | N=26, 7 trained, 3 females and 4 males, 33 ± 7.8 years. 19 recreational, 8 female and 11 male, 24.5 ± 2.4 years. |
| Tsai et al., 2020 [6] | Electromyography Analysis of Muscle Activation During Stand-Up Paddle Boarding: A Comparison of Paddling in Kneeling and Standing Positions | Biomechanics | Understand the muscle group activation in different paddling postures, kneeling and standing positions. | N=16, college students, recreational, 23.1 ± 1.8 years. |
| Novak, 2021 [51] | A Parametric Method to Customize Surfboard and Stand Up Paddle Board Fins for Additive Manufacturing. | Equipaments Computer applications |
To provide a fully customizable SUP board fins. | SUP equipment. |
| Schram et al., 2016a [7] | Laboratory- and field-based assessment of maximal aerobic power of elite Stand Up Paddle board athletes | Physiology Biomechanics |
Evaluate athletes in the laboratory and compare with results in the field. | N=10, trained, 4 females and 6 males. |
|
Schram et al., 2016b [10] |
The physiological, musculoskeletal and psychological effects of stand-up paddle boarding | Physiology Anthropometry Biomechanics |
Assess the benefit of SUP on a sedentary group, untrained individuals concerning to balance and strength. | N= 13, participants 46.15 ± 11.63 years. |
| Schram et al., 2016c [22] | Profiling the sport of stand-up paddle boarding | Physiology Anthropometry Biomechanics |
Characterized elite and recreational SUP athletes regarding anthropometry and physiology. | N=45, 2 groups, 5 females and 10 males 15 trained, 15 recreational and 15 sedentary controls. |
|
Schram et al., 2017a [23] |
A performance analysis of a Stand-Up Paddle Board marathon race | Physiology Biomechanics |
Analyze performance in a SUP marathon. | N=10, trained, 4 females and 6 males, 34.78 ± 11.49 years. |
|
Schram et al., 2017b [11] |
The Long-Term Effects of Stand-up Paddle Boarding: A Case Study | Physiology Anthropometry Biomechanics |
Document the long-term effects of participation in SUP for two individuals. | N=2, middle-aged participants 1 male and 1 female, 58 years. |
| Suari et al., 2018 [4] | The Effect of Environmental Conditions on the Physiological Response during a Stand-Up Paddle Surfing Session | Physiology | Quantify the physiological demand of an SUP session comparing with traditional surfing, analyze the impact of environmental conditions. | N=1, male, trained, 43 years. |
|
Burgess et al., 2019 [30] |
Training, Diet and Supplement Regimen of an Elite Female Stand- up Paddler in Preparation for an Ultra-distance Event: a Case Study | Physiology Anthropometry |
Examine the training, diet and supplement regimen of an elite paddler in a race preparation. | N=1, female and 32 years. |
| Balikian et al., 2020 [27] | Anaerobic Threshold in Stand-up Paddle Boarding: Comparison Between Direct and Alternative Methods | Physiology Biomechanics |
Compare the AnT evaluated by OBLA to measure the validity of CV and V30min methods. | N=8, trained, 23 ± 3 years. |
| Castañeda-Babarro et al., 2020b [28] | The Effect of Different Cadence on Paddling Gross Efficiency and Economy in Stand-Up Paddle Boarding | Physiology Anthropometry |
Determine the impact of paddling at different cadences on the movement, gross efficiency, and economy of elite paddlers. | N=10, males, 28.8 ± 11.0 years. |
| Willmott et al., 2020 [26] | The physiological and perceptual responses of stand-up paddle board exercise in a laboratory and field-setting | Physiology | Quantify and compare the physiological and perceptual responses at 10, 20 and 30 strokes/min in laboratory and field. | N=10, trained, 2 females and 8 males, 23 ± 3 years. |
| Neiva et al., 2020 [35] | A 30-min test applied to stand-up paddleboarding: A pilot study | Physiology Biomechanics |
Analyze performance, biomechanical and physiological variables during a 30 min test. | N=1, male, 28 years and 6 experience years. |
| McArthur et al., 2021 [21] | Effect of Stand-Up Paddle Boarding on Hydration Status in Recreational and Competitive Individuals | Physiology Anthropometry |
To determine the impact of a single SUP session on hydration status, through measurement of nude mass. | N=30, 18 male, 12 female, 45.63 ± 12.44 years and 6.9 ± 4.3 experience years. |
| Dyer, 2021 [53] | Insight into the development and competitiveness of male UK-based Stand-Up Paddleboard flatwater distance racing from 2013 to 2017 | Race behaviour | Investigate the development and behavior of 2 different distance races and determine whether they exhibited different racing behavior. | Male Class. |
| Authors/Year | % Body Fat | BMI (Kg/m2) | Height (cm) | Weight (kg) | |||
|---|---|---|---|---|---|---|---|
| Schram et al., 2014 [29] | Group – 17.5 ± 6.4 Males – 13.4 ± 2.3 Females – 24.4 ± 4.6 |
24.1 ± 2.3 24.4 ± 1.6 23.6 ± 3.7 |
173.2 ± 5.5 176.2 ± 3.1 168.0 ± 4.7 |
72.3 ± 6.9 75.8 ± 3.3 66.4 ± 8.0 |
|||
| Schram et al., 2016a [7] | Group – 15.87 ±7.40 Males – 11.13 ± 2.79 Females – 22.98 ± 6.25 |
24.87 ± 2.42 25.14 ± 1.36 24.46 ±3.77 |
174.00 ± 0.45 179.83 ± 6.91 165.25 ± 4.27 |
75.59 ± 11.44 81.32 ± 6.41 67.00 ± 12.66 |
|||
| Schram et al., 2016b [10] | Initial test 26.33 ± 5.15 Pre-training 26.74 ± 5.47 Post-training 26.41 ± 5.13 |
27.98 ± 4.72 28.17 ± 4.82 28.02 ± 4.38 |
- | 84.76 ± 17.22 85.45 ± 17.96 84.91 ± 16.51 |
|||
| Schram et al., 2016c [22] | Elite – 15.5 ± 6.7 Recreational – 20.3 ± 6.9 Sedentary – 27.4 ± 5.6 |
25.2 ± 2.6 24.9 ± 2.8 28.9 ± 5.1 |
174.3 ± 8.0 175.1 ± 11.3 173.2 ± 9.9 |
76.5 ± 10.6 76.8 ± 13.1 86.7 ± 17.3 |
|||
| Schram et al., 2017b [11] | Male Week 0 – 27.1 Male Week 6 – 27.3 Male Week 52 – 23.7 |
Female 0 - 28.1 Female 6 - 25.9 Female 52 - 21.5 |
30.7 30.4 28.6 |
24.8 24.5 21.5 |
Male - 188.8 Female - 152 |
96.9 96.1 90.4 |
57.2 56.7 53.5 |
| Suari et al., 2018 [4] | - | 26.6 | 1.68 | 76.5 | |||
| Burgess et al., 2019 [30] | Baseline – 19% Race Week – 17% |
- | - | 62.7 65.0 |
|||
| Schram et al., 2019 [23] | Experienced Inexperienced |
- | 173.9 ± 50.5 174.1 ± 63.3 |
76.5 ± 12.2 72.9 ± 11.3 |
|||
| Balikian et al., 2020 [27] | 9.4 ± 1.9 | - | 173.0 ± 6 9.0 | 66.9 ± 5.8 | |||
| Castañeda-Babarro et al., 2020a [13] | - | 23.6 ± 2 | 175 ± 4.2 | 74.6 ± 6.6 | |||
| Castañeda-Babarro et al., 2020b [28] | 12.7 ± 3.9 | - | 175.4 ± 5.1 | 74.2 ± 9.4 | |||
| Neiva et al., 2020 [35] | - | - | 1.83 | 74 | |||
| Tsai et al., 2020 [6] | - | - | 175.22 ± 5.30 | 70.83 ± 10.58 | |||
| Willmott et al., 2020 [26] | - | 24.3 ± 1.5 | 170 ± 9 | 70.5 ± 9.1 | |||
| McArthur et al., 2021 [21] | - | Group – 24.37 ± 1.9 Males – 24.90 ± 1.7 Females – 23.50 ± 2.1 |
Group – 1.74 ± 0.09 Males – 1.79 ± 0.08 Females – 1.67 ± 0.05 |
Group – 75.11 ± 11.52 Males – 80.66 ± 10.27 Females – 65.75 ± 6.33 |
|||
Fifteen studies examined individuals practicing SUP with varying levels of experience and skill, focusing on their anthropometric measurements. Variables such as height, weight, body mass index (BMI), and body fat percentage were the predominant parameters evaluated, with varying results across studies. A comprehensive review of anthropometric assessment is provided in Table 2.
A selection of ten studies in the field of biomechanics was analyzed. These studies examined a number of facets, including postural control, physical performance, muscle activity, body balance, and technology assessment. A comprehensive summary of the results derived from these studies is presented in Table 3.
| Authors/Year | Protocol | Findings |
| Schram et al., 2014 [29] | Tests via ultrasound (cross-section of the multifidus). Postural control tests. Lumbar extension isometric test. |
Greater levels of dynamic postural control indicated by reduced, velocity of sway in comparison to local and national level surfers. |
| Schram et al., 2016a [7] | Laboratory test, progressive VO2max ergometer protocol beginning at 5 W with an increase of 5 W every minute until individual burnout. Field test, Progressive VO2max starting at 30 strokes/min and increasing cadence by 5 strokes/min each min, until individual burnout. |
A significant difference was found in peak speed measured in the field (+42.39%) compared with in the laboratory. |
| Schram et al., 2016b [10] | Laboratory test, the ergometer VO2max protocol began at an initial of 5 W with a 2 W increase each minute until volitional exhaustion. The maximum anaerobic power, paddled maximally for 10 s from a stationary start. |
Peak speed increased 15.79 % and distance covered in 10 s increased 12.37 %. |
| Schram et al., 2016c [22] | Laboratory test, progressive VO2max ergometer protocol beginning at 5 W with an increase of 5 W every minute until individual burnout. The maximum anaerobic power, paddled maximally for 10 s from a stationary start. |
The elite group displayed better results in both aerobic and anaerobic tests in terms peak stroke rate, distance covered, and peak speed compared to the recreational and sedentary groups. |
| Schram et al., 2017b [11] | Analyze the performance in a SUP marathon. | Range of distance (13.3-13.9 km) and peak speed (18.8-26.4 km/h). |
| Chen et al., 2018 [52] | The system of a rider standing on a SUP paddleboard was modeled as a planar motion of a buoyant body with a rectangular cross-section, with an added mass attached at a fixed height. | The eigenvalue contours are in good agreement with qualitative terms such as beginner and professional. The analytical results of the rectangular board show the same trend as the experimental results from a real SUP product. |
| Dyer, 2018 [50] | One participant completed a series of randomized runs at 2.5 m/s over a distance of 230 meters in three separate test events, all held at a flat-water test venue. | The proposed assessment method is recommended as a specific, geographically accessible, and cost-effective means of evaluating SUP technology. |
| Ost et al., 2018 [25] | Performing the tandem Romberg posture (heel-to-toe). Body balance tested in a tiptoes posture, with the ankles in full plantar flexion and keeping the feet barely hip width apart. Both postures were evaluated for a time interval of 30 seconds. | Reduction in anteroposterior and mediolateral amplitudes of body sway in both visual conditions, while walking had no effect on balance. |
| Schram et al., 2019 [24] | Laboratory test, 2 successive paddling attempts (both sides), in a randomized predetermined fashion during 40 s keeping a power of 20 W. | Greater overall shoulder ROM and less hip ROM for inexperienced and shoulder motion at the end of the paddle stroke and more extension at the elbow for the experienced ones. |
| Tsai et al., 2019 [6] | Field tests in an outdoor pool, the participants replicated paddling at a comfortable speed in a standing position (2 times) and kneeling (1 time) alternating sides after 3 strokes. | Biceps showed continuous activation in the pull phase and higher when kneeling. Peak muscle activity of the external oblique of the abdomen and triceps were higher in standing. Gastrocnemius was activated to maintain stability. |
| Bakilian et al., 2020 [27] | Field test, 3 maximal efforts at 400, 500 and 800m; 3 efforts at 85, 90, and 100% of maximal 500m and a 30-minute continuous effort. | The maximal efforts of 400, 500, and 800m took 153.8 ± 14.6, 194.3 ± 18, and 319.3 ± 25.8 seconds, respectively. The relationship between distance and time showed high levels of linearity. The total distance covered during the 30-minute effort was 4,173.8 ± 241.8m. |
| Neiva et al., 2020 [35] | Field test, in calm water, a 30-minute continuous test. | 3700m performed at 2.19 ± 0.32 m. s-1, 52.63 ± 2.62 strokes/min, and 2.39 ± 0.39 m per stroke. |
A selection of nine studies examined heart rate (HR) responses, aerobic and anaerobic performance, and physiological demands associated with SUP under a variety of conditions, including exercise protocols, stroke rates, and participant characteristics. A summary is provided in Table 4.
Table 4.
| Authors/Year | Protocol | Findings | |
| Schram et al., 2016a [7] | Laboratory test, progressive V02max ergometer protocol beginning at 5 W with an increase of 5 W every minute until individual burnout. Field test, Progressive V02max starting at 30 strokes/min and increasing cadence by 5 strokes/min each min, until individual burnout. |
HR mean b·min-1/HRmax Laboratory - 180.9 ± 15.58 Field - 183 ± 9.89 |
HRpeak b·min-1 |
| Schram et al., 2016b [10] | Laboratory test, the ergometer VO2max protocol began at an initial of 5 W with a 2 W increase each minute until volitional exhaustion. The maximum anaerobic power, paddled maximally for 10 s from a stationary start. |
- | Initial test - 171.46 ± 16.72 Pre-training - 172.31 ± 16.10 Post training - 171.23 ± 15.14 |
| Schram et al., 2016c [22] | Laboratory test, progressive V02max ergometer protocol beginning at 5 W with an increase of 5 W every minute until individual burnout. The maximum anaerobic power, paddled maximally for 10 s from a stationary start. |
Predicted HRmax Elite - 102.7% Recreational - 103.9% Sedentary - 98.0% |
Elite - 186.60 ± 15.00 Recreational - 187.6 ± 13.71 Sedentary - 173.93 ± 17.21 |
| Schram et al., 2017a [23] | 12.7 km, a 0.89m low tide, 11 knot northerly wind with 14 knot gusts, 0.5 m of swell with a 5 sec wave period at the beginning of the endurance run. | Group - 168.56 ± 9.79 Males - 172.00 ± 10.32 Females - 161.67 ± 3.21 |
Group - 187.00 ± 13.52 Males - 194.17 ± 9.87 Females - 172.67 ± 5.03 |
| Suari et al., 2018 [4] | 10 sessions analyzed, 14.9 hours duration. Preceding to the sessions, 2 maximum aerobic tests were performed, first in a bicycle ergometer and after a week on a manual ergometer. |
53% of the sessions, the HR was maintained between 60% and 80% of the HRmax. 47% of the sessions, the HR exceeded 80% of HRmax. In 18% of the sessions, the HR exceeded 90% of HRmax. |
Quick Fall and Long Fall, median of 155 and 154 bpm, 85.0% and 85.5% HRmax. Riding waves, 152 bpm, 83.9% HRmax. Paddling to Peak, 150 bpm, 82.7% bpm. General Paddling, 139 bpm, 76.8% HRmax. |
|
Castañeda-Babarro et al., 2020b [28] |
Firstly incremental exercise test was conducted to assess maximal oxygen uptake and peak power output (PPO). Second test, 3 trials of 8 min each at 75% of PPO reached in the first test session. Three cadences were carried out in different trials randomly assigned between 45–55 and 65 strokes-min−1 (spm). | HRmax 183.2 ± 14.1 Range - 164 - 207 |
- |
| Neiva et al., 2020 [35] | Field test, in calm water, a 30-minute continuous test. | 160.78 ± 3.18 bpm Predicted HRmax - 85.34%. |
- |
| Willmott et al., 2020 [26] | Laboratory test, VO2peak ergometer, outset at 20 strokes min−1 and afterwards growing at 3 strokes min−1 until individual burnout. Incremental SUP trials - Paddled for 5-min at stroke rates of 10, 20 and 30 strokes min−1; Field tests - Paddled for 10, 20 and 30 strokes min−1 for 5-min per step. |
Laboratory - 5min - 105 ± 8, 10min - 128 ± 13, 15min – 155 ± 17. Field - 5min – 107 ± 17, 10 min 121 ± 14, 15min – 136 ± 18. |
VO2peak SUP test - Max HR - 186 ± 8 |
| McArthur et al., 2021 [21] | In a cross-sectional study, heart rate (HR) was monitored throughout the SUP session using a telemetry HR monitor watch and chest strap, with both average and peak HR, and duration being recorded. | Group - 135 ± 20.3 Males - 140 ± 15.5 Females - 125 ± 24.1 |
Group - 167.1 ± 17.2 Males - 167.0 ± 12.9 Females - 167.2 ± 23.3 |
Analysis of the physiological demands associated with various conditions includes both laboratory and field exercise protocols. These range from progressive maximal oxygen consumption (VO2max) testing to
maximal anaerobic power assessment. In addition, some studies have aimed to compare responses between different performance levels of athletes and to analyze the effects of stroke rate, which are summarized in Table 5.
Table 5.
| Authors/Year | Protocol | Findings |
| Schram et al., 2016a [7] | Laboratory test, progressive V02max ergometer protocol beginning at 5 Watts (W) with an increase of 5 W every minute until individual burnout. Field test, Progressive V02max starting at 30 strokes/min and increasing cadence by 5 strokes/min each min, until individual burnout. |
Field - V̇O2max (45.48 ± 6.96 mL · kg-1 · mim-1). Laboratory - V̇O2max (43.20 ± 6.67 mL · kg-1 · min-1). |
| Schram et al., 2016b [10] | Laboratory test, the ergometer VO2max protocol began at an initial of 5 W with a 2 W increase each minute until volitional exhaustion. The maximum anaerobic power, paddled maximally for 10 s from a stationary start. |
Aerobic (+23.57 %) and anaerobic fitness (+41.98 %) improvements. |
| Schram et al., 2016c [22] | Laboratory test, progressive V02max ergometer protocol beginning at 5 W with an increase of 5 W every minute until individual burnout. The maximum anaerobic power, paddled maximally for 10 s from a stationary start. |
Elite - V̇O2max 43.7, s = 5.89 ml · kg–1 · min–1, anaerobic power outputs 35.7, s = 11.1 W. Recreational - V̇O2max 31.9, s = 7.68 ml · kg–1 · min–1, anaerobic power outputs 25.0, s = 11.7 W Sedentary – V̇O2max 20.35, s = 3.69 ml · kg–1 · min–1, anaerobic power outputs 13.5, s = 7.1 W. |
| Schram et al., 2017b [11] | Laboratory test, the ergometer VO2max protocol began at an initial of 5 W with a 2 W increase each minute until volitional exhaustion. The maximum anaerobic power, paddled maximally for 10 s from a stationary start. |
Aerobic fitness improved by 25.0% in the male (+ 5.5 ml/kg/min) and 42.3% in the female (+ 12.2 ml/kg/min). |
| Castañeda-Babarro et al., 2020b [28] | Incremental exercise test was conducted to assess maximal oxygen uptake and peak power output (PPO). Second test, 3 trials of 8 min each at 75% of PPO reached in the first test session. 3 cadences were carried out in different trials randomly assigned between 45–55 and 65 strokes-min−1 (spm). | Respiratory exchange ratio (RER) at 4-min than at 8-min in 55 spm (4-min, 0.950 ± 0.065 vs. 8-min, 0.964 ± 0.053) and 65 spm cadences (4-min, 0.951 ± 0.030 vs. 8-min, 0.992 ± 0.047). VO2 and lactate were lower at 45 spm (VO2, 34.4 ± 6.0 mL·kg−1 ·min−1; Lactate, 3.5 ± 1.0 mmol·l −1), at 55 spm (VO2, 38.6 ± 5.2 mL·kg−1 ·min−1; lactate, 4.2 ± 1.2 mmol·l −1 |
| Willmott et al., 2020 [26] | Laboratory test, VO2peak ergometer, outset at 20 strokes min−1 and afterwards growing at 3 strokes min−1 until individual burnout. Incremental SUP trials - Paddled for 5-min at stroke rates of 10, 20 and 30 strokes min−1; Field tests - Paddled for 10, 20 and 30 strokes min−1 for 5-min per step. |
Laboratory: VO2, EE and METs. 10 spm - 0.68 ± 0.19 (L min−1); 3.3 ± 1.0 (kcal min−1); 2.7 ± 0.5; 20 spm - 1.09 ± 0.18 (L min−1); 5.5 ± 0.9 (kcal min−1); 4.4 ± 0.7; 30 spm - 1.52 ± 0.31 (L min−1); 7.6 ± 1.6 (kcal min−1); 6.1 ± 1.2 Field: Estimated (VO2, EE, METs) 10 spm - 0.72 ± 0.28 (L min−1); 3.6 ± 0.9 (kcal min−1); 2.7 ± 0.9; 20 spm - 1.01 ± 0.24 (L min−1); 4.3 ± 1.8 (kcal min−1); 3.5 ± 1.0; 30 spm - 1.32 ± 0.36 (L min−1); 6.3 ± 2.1 (kcal min−1); 4.6 ± 1.4. |
| Bakilian et al., 2020 [27] | Field test, CV determination: 3 best performances at 400, 500 and 800m, adopting distance-time relationship. OBLA determination: 3 efforts at 85, 90, and 100% of maximal 500m effort to determine the velocity related to 3.5 mmol·L-1 of lactate. V30min determination: a 30-minute continuous effort to determine the V30min. |
OBLA (2.35 ± 0.13 m·s-1) and the alternative methods (CV: 2.42 ± 0.20 m·s-1 and V30min: 2.32 ± 0.13 m·s-1). The mean [La-] after the 30-minute continuous effort was 3.9 6 0.2 mmol·L-1. |
4. DISCUSSION
The main objective of this study is to present and analyze the existing body of research published in the field of SUP, with an emphasis on future research. In particular, the number of publications focusing on the performance dimensions of SUP remains relatively limited compared to the rapid increase in the sport’s popularity observed over the past decade. A total of 21 articles were included in this systematic review and divided into four different categories: anthropometry, biomechanics, physiology and equipment, materials, and race behavior. A comprehensive analysis of these articles is presented in the following sections.
4.1. Anthropometry
The studies showed some variability in body fat percentage. For example, in one particular study [29], the collective group had an average body fat percentage of 17.5%, with males having a lower average of 13.4% compared to 24.4% for females. Another study [7] showed a reduction in the average body fat percentage for the entire group of 15.87%, again with males having a lower average of 11.13% compared to 22.98% for females. In addition, elite SUP athletes had a mean body fat percentage of 15.5%, suggesting a leaner body composition compared to the general population [22]. Additional research [30] suggested that preparation for SUP competitions could result in a decrease in body fat, with an average of 19% at baseline and 17% during race week. Overall, participants generally had an average BMI within the range considered normal for adults, ranging from 18.5 to 24.9 kg/m2 [7, 22, 29]. However, some studies reported different values. For example, experienced SUP practitioners reported an average body fat percentage of 24.3% and a BMI of 76.5 kg/m2, with an average height of 170 cm and an average weight of 70.5 kg [24]. In other cases, data are presented for all groups combined and by gender. Mean body fat percentages ranged from 23.50% to 24.90%, BMIs ranged from 1.67 to 1.79 kg/m2, and mean weights spanned from 65.75 kg to 80.66 kg [21]. These observations highlight the diversity inherent in the anthropometry of SUP practitioners, demonstrating a spectrum of physical characteristics within this population. The sedentary population [10, 11] also demonstrated diversity in body fat percentage, BMI, height, and weight.
In summary, the research conducted on SUP athletes revealed variations in body fat percentage, BMI, height, and weight. The results suggest that, overall, SUP practitioners have average body fat and BMI levels within the range considered normal for adults. Specifically, gender differences were found, with males having lower average body fat and BMI values compared to females. Elite SUP athletes had a leaner body composition and lower average body fat percentage compared to the general population. In addition, there may be a reduction in body fat prior to SUP competition. However, it is important to note that there was variability in the reported means among the different studies. Body fat percentage, BMI, height, and weight varied within these studies, demonstrating the range of physical characteristics among SUP practitioners. This heterogeneity may be due to factors such as fitness level, experience, gender, age, and individual characteristics. Finally, studies of sedentary individuals also revealed a range of body fat percentage, BMI, height, and weight measurements. In conclusion, the available data underscore the range of anthropometric measures observed among SUP practitioners and serve as a testament to the physical heterogeneity inherent in this population.
4.2. Biomechanics
Understanding the biomechanical principles applied to SUP can help identify limiting factors to performance, compare athlete groups, optimize paddling technique, and prevent injury. Despite the limited scope of the studies, their findings may prove invaluable to coaches, therapists, and participants who need to maximize performance and minimize the risk of injury during exercise [24]. Therefore, topics such as time-motion analysis, stroke parameters, electromyography (EMG), and global positioning system (GPS) will be addressed. Time-motion analysis (TMA) is a reliable method for analyzing athletic performance by examining video footage frame by frame. These systems are designed to track the motion of body segments, derive joint and segment kinematics, and provide additional information through further processing using complex muscle and/or skeletal models [31]. Motion analysis has been widely used in various sports for quantitative purposes, including evaluation of technique and competition [32]. The proliferation of high-resolution cameras in mobile communication devices has democratized this form of analysis [33], making it a valuable tool for evaluating SUP performance.
The importance of technique in SUP is underscored by the association between less-than-optimal stroke biomechanics and shoulder, elbow, and back injuries observed in similar sports such as kayaking and outrigger paddling [24, 34]. The first study to investigate the kinematics of the SUP stroke found significant differences in joint kinematics between experienced and inexperienced participants [24]. Specifically, inexperienced participants demonstrated greater total shoulder range of motion (ROM) (78.9 ± 24.9 vs. 56.6 ± 17.3) and less hip ROM (50.0 ± 18.5 vs. 66.4 ± 11.8) than experienced participants. In addition, experienced participants had more shoulder motion at the end of the paddle stroke (74.9 ± 16.3 vs. 35.2 ± 28.5 minimum shoulder flexion) and more elbow extension (6.0 ± 9.2 minimum elbow flexion vs. 24.8 ± 13.5) than inexperienced participants. These results suggest that experienced paddlers perform a more efficient SUP stroke, possibly due to a larger catch angle and longer stroke length, resulting in a higher peak power output. Differences in ankle-to-hip power and knee angle also suggest that experienced paddlers use more muscle groups during the stroke, resulting in greater overall efficiency.
One study [25] examined the effects of SUP training on balance stability in older adults. Participants performed various demanding postures to assess their balance before and after the training. Kinematic analysis of body sway was performed by attaching flat markers to the acromion of the right shoulder and the seventh cervical vertebra using the KINOVEA software. The results showed a significant reduction in trunk sway in the SUP training group compared to the control group. This improvement was observed in both the Romberg posture and the tiptoe posture. Furthermore, SUP training also resulted in improved balance stability under conditions of visual deprivation.
In the context of stroke parameters in SUP and the distances achieved, it is important to distinguish between those obtained during training sessions, competitive events, and study protocols. In a competitive context, during a marathon race [23], there were differences in the distance covered due to external variables on the race day and their consequent impact on results. The results showed that the average distance covered by the participants was 13.56 km, ranging from 13.34 km to 13.87 km. In the calm water field tests [27, 35], subjects performed 30 minutes of continuous exercise and covered a distance of 4,173.8 ± 241.8 m and 3,700 m, respectively. In the laboratory ergometer tests [10], the values for the aerobic and anaerobic performance conditions were presented separately for the baseline, pre- and post-training tests. For the aerobic condition, the mean distance covered was 366.68 ± 71.90 m in the baseline test, 336.21 ± 101.97 m in the pre-training test, and 486.80 ± 134.64 m in the post-training test. For the anaerobic condition, the mean distance covered was 14.90 ± 2.96 m in the baseline test, 15.28 ± 2.68 m in the pre-training test, and 17.17 ± 2.48 m in the post-training test. In terms of profiling [22] and providing original data on elite SUP athletes, as well as comparisons with recreational and sedentary individuals with no prior exposure to the sport, men achieved the following distances in aerobic testing: 747.59 ± 128.66 m for the elite group, 503.51 ±159.97 m for the recreational group, and 368.90 ±68.42 m for the sedentary group. For the maximum anaerobic power tests, the distances achieved were 20.60 ± 3.08 m for the elite group, 17.29 ± 3.60 m for the recreational group, and 14.07 ± 2.88 m for the sedentary group. The studies reviewed represent a wide range of distances covered in different contexts. In competitive events, participants covered an average distance of 13.56 km. In field tests, one athlete achieved a total distance of 3700 m in 30 minutes in calm water, while in another study, subjects achieved a total distance of 4,173.8 ± 241.8 m in 30 minutes of continuous exercise. In laboratory ergometer tests, the distances covered were presented separately for different conditions, such as aerobic and anaerobic, and ranged from 14.90 m to 486.80 m. In a study comparing elite athletes, recreational athletes, and sedentary individuals, the distances covered also showed differences between the groups [22].
When analyzing speed, the marathon performance showed a mean speed of 9.78 ± 0.70 m/s, with male participants showing a slightly higher mean speed of 10.13 ± 0.53 m/s compared to female participants, who maintained a mean speed of 9.07 ± 0.41 m/s [11]. During maximal aerobic SUP testing, speeds were slightly slower. Under calm water conditions without current interference, an athlete achieved a mean speed of 2.19 ± 0.32 m/s during a maximal SUP test [35]. Using an ergometer [22], the maximal speed during an aerobic test was 2.18 ± 0.16 m/s for the elite class, 1.93 ± 0.24 m/s for the recreational group, and 1.50 ± 0.15 m/s for the sedentary group. When assessing anaerobic performance, the elite group reached a maximum speed of 2.35 ± 0.32 m/s, the recreational group reached 1.99 ± 0.40 m/s, and the sedentary group reached 1.62 ± 0.31 m/s. Notably, both tests showed significant differences between the elite group and the other participant groups.
Furthermore, the literature has shown that the maximum speed values were significantly increased in the field environment (average of 3.09 ± 0.32 m/s) compared to the laboratory setting (2.17 ± 0.13 m/s) [7]. However, the differences in speed measurements between the two settings are likely due to the different methods used to quantify speed. The laboratory-based speed measurement is based on the moment of inertia of the ergometer flywheel, whereas the field-based measurement was obtained using the integrated GPS and gas analysis system. In summary, some studies [7, 10, 11, 22, 35] reported different values for maximal speed in different conditions and participant groups. A higher mean maximal speed was found in the field compared to the laboratory setting. In addition, elite athletes had higher maximal speeds in both aerobic and anaerobic conditions compared to recreational and sedentary individuals. Furthermore, gender differences in maximal speeds were observed, with male participants achieving higher mean and maximal speeds than female participants.
During a 30-minute session in calm waters, the record paddle rate was 52.63 ± 2.62 paddles per minute, with an average distance covered per paddle of 2.39 ± 0.39 meters [35]. The use of ergometers to assess the maximum paddle rate (the maximum number of SUP paddles per minute) and the average length of each SUP paddle varied significantly between different groups [22]. The elite group had a maximum paddle rate of 69.6 paddle/min and a mean paddle length of 2.19 meters, while the recreational group had a maximum paddle rate of 55.47 paddle/min and a mean paddle length of 2.24 meters. In contrast, the sedentary group had a maximum paddle rate of 42.27 paddle/min and a mean paddle length of 2.34 meters. These results suggest that elite paddlers, on average, performed more paddles in each time period but paddled for a shorter average paddle length compared to their recreational and sedentary counterparts. In one study [10], the results showed a significant increase in mean paddle length (2.38 ± 0.46 m at baseline and 2.52 ± 0.40 m after training) and maximum paddle length (2.89 ± 0.66 m at baseline and 2.96 ± 0.61 m after training) after SUP training. These changes indicate an improvement in paddling efficiency and power. In addition, the maximum paddle rate (paddles/min) also increased after training (43.77 ± 4.71) compared to baseline (41.15 ± 9.10), suggesting an improvement in the ability to perform high-speed paddles. During a 30-minute session, an individual participant maintained an average paddle rate of approximately 52.63 paddles per minute, with each paddle covering an average of 2.39 meters [35]. Significant differences in paddle rate and paddle length were found between the different groups, with the elite group performing higher rates with shorter lengths compared to the recreational and sedentary groups [22]. In contrast, one study [10] reported a significant improvement in mean and maximal paddle length, suggesting an improvement in paddle efficiency and power after SUP training, and an increase in maximal paddle rate, suggesting an improvement in the ability to perform high-speed paddles.
Surface electromyography (sEMG) is a widely used research tool in sports due to its ability to provide dynamic analysis, making it an important tool for optimizing movement, sports equipment, training techniques, and, ultimately, sports performance [36, 37]. The comprehensive assessment and feedback provided by sEMG analysis of muscular action allows for the optimization of athletic training and performance [38]. In addition, a complete understanding of the biomechanical demands of the sport can be achieved by synchronizing the EMG system with other technologies, such as cameras and electro-goniometers, that provide kinetic and kinematic data [39]. This integration allows researchers to gain a more accurate and detailed understanding of the movement patterns and muscular activity and to use this information to improve training and performance. EMG analysis can provide valuable information about muscle activation patterns and timing during different phases of the paddle stroke in the context of SUP [40]. One study [6] aimed to compare muscle activation patterns in kneeling and standing SUP positions using EMG analysis. The researchers measured the activity of the rectus femoris, biceps femoris, tibialis anterior, gastrocnemius, erector spinae, and upper trapezius muscles while participants paddled in both positions. The results showed significantly higher activation of the rectus femoris and biceps femoris muscles in the standing position compared to the kneeling position, while the anterior tibialis muscle showed significantly higher activation in the kneeling position compared to the standing position. The gastrocnemius muscle showed similar activation levels in both positions. The erector spinae and upper trapezius muscles also showed higher activation levels in the standing position, although the difference was not statistically significant. Overall, the study suggests that the standing position in SUP results in greater activation of the leg muscles, while the kneeling position results in greater activation of the anterior tibialis muscle.
The use of GPS in sports allows practitioners to evaluate athletic training programs and researchers to better investigate applied research questions [41]. Such devices have primarily been used to study exercise monitoring in athletes [42] and neuromuscular fatigue [43]. To date, there are only seven studies that have used GPS technology in SUP to track athletes' events [23], sessions [4, 20], and laboratory or field studies [7, 13, 26, 35]. These studies have provided valuable information on the external demands of SUP in competition, session, or testing, such as stroke rate, distance per stroke, distance paddled by athletes, speeds generated while surfing, course completion time, course distance, average speed, maximum speed, peak speed, distance per minute, and the impact of weather conditions. These variables provide insight into the sport and the workloads encountered, providing coaches with valuable information that can be used to develop and prescribe training/session programs.
4.3. Physiology
Physical performance in various competitive sports events is largely dependent on the integrated state of various physiological mechanisms [44]. Thus, aerobic and anaerobic capacities are key determinants of elite profiles [7] and performance outcomes [23]. Monitoring HR, anaerobic threshold, and energy expenditure during SUP are the indicators discussed below. HR has been analyzed in cross-sectional observational studies [20, 22, 26] in the laboratory [28], in the field [7, 35], in training programs [10], in competitions [11], and in training sessions [4]. A total of eight studies were conducted with SUP practitioners of different performance levels. The reviewed studies suggest that HR is an important physiological response during SUP and can be used to monitor exercise intensity and performance. Some studies [7, 10, 22, 23] indicated that there were no significant differences in maximal HR between elite, recreational, and sedentary participants and that HR measurements were consistent between laboratory and field testing. In addition, HR remained relatively stable after the implementation of a training program, suggesting that it is a reliable indicator of exercise intensity.
SUP surfers spend a significant portion of their sessions at HRs above 70% of their maximum HR [4]. The highest HRs have been observed when surfers fall off the board and when paddling back out, suggesting that these activities are particularly demanding. Paddling cadence can affect HR, with higher cadences resulting in higher HRs during an 8-minute test [13]. Laboratory data suggest that as the SUP stroke rate increases, HR also increases, reflecting an increase in exercise intensity. Field data suggest that as the SUP stroke rate increases in the outdoor environment, the HR also increases, reflecting a higher exercise intensity [26]. Comparing the two situations, the mean HR and percentage of maximal HR were higher during the laboratory test at 30 strokes per minute but not at 10 or 20 strokes per minute. During a 30-minute maximal effort SUP test, HR remained relatively stable, indicating that athletes were able to maintain a consistent level of intensity throughout the test [35]. Male and female participants have similar peak HRs during SUP, but males have a higher average HR [20]. In addition, SUP can be considered a vigorous aerobic activity based on HRs relative to the predicted maximum HR for age. Overall, the reviewed studies suggest that HR is a valuable indicator of exercise intensity and performance during SUP, with HRs above 70% of maximum HR being common during sessions. Paddling cadence can also affect HR, with higher cadences resulting in higher HRs. It is important to control the pace during SUP in order to maintain an appropriate level of intensity throughout the session.
A total of seven studies have evaluated the anaerobic threshold and energy expenditure during SUP. These assessments were performed both in the laboratory using ergometers [7, 10, 11, 22, 28], by comparing data from laboratory and field conditions [7, 26], and by field testing [27]. Peak aerobic power was significantly higher in elite SUP athletes compared to the recreational and sedentary groups [22]. Peak aerobic power was also significantly higher in the elite group than in the others. The study also found gender differences, with elite men having higher VO2max than elite women, and sedentary women having the lowest mean VO2max. Field-based measures of maximal aerobic power were significantly higher (+5.28%) than laboratory-based measures [7]. Men had significantly higher maximum aerobic power than women in both the laboratory and the field, and there was a strong positive correlation (r = 0.907) between absolute V̇O2max recorded in the laboratory and the field. Field measurements were higher in 80% of the subjects tested, with only two subjects showing higher values in the laboratory.
Six weeks of SUP training resulted in significant improvements in both absolute and relative aerobic power, with increases of 18.86% and 23.57%, respectively [10]. In addition, there was a weak negative correlation (r = -0.32) between the age of participants and the percentage increase in VO2max throughout the study. The study also found significant improvements in anaerobic fitness, with a 41.74% increase in anaerobic power production and a 42.11% increase in relative power production over the training period. A long-term intervention [11] showed significant improvements in both aerobic (2.8 ml/kg/min; +13.0%) and anaerobic (2 W; +20.8%) power. The most significant improvements were observed in one participant who increased aerobic power by 6.3 ml/kg/min and anaerobic power by 5.3 W.
In the laboratory, significant main effects were observed for energy expenditure (EE), metabolic equivalents (METs), V̇O2, and ventilation (VE) as SUP paddling rates progressed from 10 to 30 strokes per minute. Similarly, in the field setting, significant main effects were observed for estimated EE, METs, and V̇O2, with all variables increasing significantly as SUP paddling rates increased from 10 to 30 strokes per minute. Moreover, economy (45.3 ± 5.7 KJ·l-1 at 45 rpm vs. 38.1 ± 5.3 KJ·l-1 at 65 rpm; p = 0.010) and gross efficiency (13.4 ± 2.3% at 45 rpm vs. 11.0 ± 1.6% at 65 rpm; p = 0.012) were higher at 45 rpm than at 65 rpm during an 8-minute test. The respiratory exchange ratio was lower at 4 minutes than at 8 minutes at both cadences of 55 rpm (4 min, 0.950 ± 0.065 vs. 8 min, 0.964 ± 0.053) and 65 rpm (4 min, 0.951 ± 0.030 vs. 8 min, 0.992 ± 0.047; p < 0.05). In addition, VO2 and lactate were lower at 45 rpm (VO2, 34.4 ± 6.0 mL·kg-1·min-1; lactate, 3.5 ± 1.0 mmol·l-1) compared to 55 rpm (VO2, 38.6 ± 5.2 mL·kg-1·min-1; lactate, 4.2 ± 1.2 mmol·l-1) and 65 rpm (VO2, 38.7 ± 5.9 mL·kg-1·min-1; lactate, 5.3 ± 1.8 mmol·l-1) at 8 minutes. Additionally, lactate was higher at 65 rpm than at 55 rpm at 8 minutes. Athletes had a higher aerobic and anaerobic capacity compared to recreational and sedentary individuals. There were also gender differences, with elite males having higher mean VO2max values than elite females and sedentary females having the lowest VO2max values. In additional, maximal aerobic power measured in the field was found to be significantly higher than that measured in the laboratory. Studies have also shown that SUP rowing rates affect several physiological measures, with all variables increasing significantly as SUP rowing rates increased from 10 to 30 strokes per minute. Finally, economy and gross efficiency were found to be higher at lower rowing rates (45 strokes per minute) than at higher rates (65 strokes per minute) during an 8-minute test.
4.4. SUP Equipment, Materials, and Race Behavior
Equipment innovation aims to increase access to sport and improve performance [45], and it is necessary to understand the variables that affect performance before designing equipment. Once these variables are identified, equipment can be designed to modify them and achieve the desired outcomes [46]. The ergometer is an important piece of equipment for a rower because it facilitates the in-water rowing mechanism [47]. There are notable differences between in-water strokes and out-of-water strokes when using an ergometer or rowing boat, particularly with respect to the gear ratio, the pattern of force increase, and the magnitude of the force produced [48, 49]. In SUP, the devices that have been used for biomechanical and physiological analysis include swimming ergometers [13] and SUP-specific ergometers [7, 10, 11, 22, 24, 26].
In technology assessment, one study evaluated the intra-test reliability of a proposed outdoor field evaluation methodology for three levels of SUP technology [50]: boards, paddles, and fins. The study compared two different SUP boards: the high-tech Sprint board and the basic Allstar board. The Sprint board outperformed the Allstar board in terms of paddle speed and stability, while the Allstar board had the worst performance. The study also evaluated three types of SUP paddles: carbon, hybrid, and aluminum. The results showed that the high-tech carbon paddle performed better in terms of paddle speed. However, there were no significant differences in performance regarding board stability or wind resistance. Finally, three types of SUP fins were evaluated: carbon, fiberglass, and plastic fins. The high-tech carbon fins performed better in terms of paddle speed and stability, while the basic plastic fins performed the worst. Another study proposes a parametric method for customizing fins through additive manufacturing (3D printing) [51]. The methodology is based on a parametric model that allows users to adjust the dimensions of the fins according to their preferences and abilities. Specifically, the fin system, its position on the board, cant, depth, sweep, base length, base foil profile, tip sharpness, tip thickness, and overall dimensions can be adjusted within a limited range of values, resulting in a 3D printable geometry. The method of creating the parametric system is sufficiently detailed to be replicable and constructed by designers, and future research directions are outlined to improve SUP performance and expand the well-established culture of experimentation within the sport.
In evaluating the stability of the human-SUP system under varying water conditions, one study [52] found that the position of the rider on the board plays a critical role in the stability of the system, with a central position providing greater stability. In addition, the study developed a stability map for the coupled system by modeling the governing equations of the buoyant body system and performing asymptotic stability analysis. The analytical results of the eigenvalue contours from the stability analysis were compared to current industrial SUP dimensions, allowing users to select a SUP board that balances stability and maneuverability.
An analysis of two SUP events from different years to determine if there were any changes in their participation or behavior during the race and whether such events should be approached differently by practitioners [53] suggested that the differences were more related to the distance of the race than to the specific characteristics of each event. The study also suggested the use of a Perceived Intensity Chart diagram to assess the competitiveness and quality of a SUP event. In addition, optimizing equipment choices and implementing technologies such as GPS trackers can positively impact competitors' performance and provide a better understanding of the dynamics of SUP racing.
Overall, the studies highlighted the importance of equipment innovation in improving performance and increasing accessibility to the sport of SUP. The use of ergometers and specific biomechanical and physiological analysis devices can help to understand the variables that affect performance and facilitate the design of equipment to modify them. Furthermore, technological evaluations of SUP equipment, such as boards, paddles, and fins, have shown significant differences in performance based on material and design. Finally, understanding the stability of the human-SUP system in varying water conditions is critical to selecting an SUP board that balances stability and maneuverability. In conclusion, these studies demonstrate the potential for technology and innovation to enhance the sport of SUP and encourage research to improve performance and expand the culture of experimentation within the sport.
4.5. Limitations of the Study
The first article that met the inclusion criteria for this study was published in 2014, coinciding with the resurgence of the field at the beginning of the century. A lack of both overall studies and comparable studies limited this review. As mentioned previously, research on SUP performance is an emerging area, and as a result, only 21 studies from a small number of research groups met the inclusion criteria for this review. In addition, the review was limited to English-language publications and conference abstracts, which may have excluded important published studies on SUP performance. Although an extensive database search was conducted, the use of other databases could have further strengthened this review. The studies included in this review were diverse and segmented, lacking consistency in thoroughly characterizing specific domains. Moreover, the diversity of research questions and methodologies used in these studies makes it difficult to compare results and draw concrete conclusions to guide future recommendations. Nevertheless, the volume of SUP-related research is increasing. This trend illustrates the evolution of scientific curiosity in the field of SUP as researchers seek to address pertinent questions that span both broad and specific topics.
4.6. Future Research
Future SUP research has significant potential to advance understanding in several research areas. In SUP biomechanics, motion analysis, aided by increasingly accessible motion capture technologies, will facilitate the study of how variables such as paddle angle, stroke length, and rhythm affect performance. The integration of surface electromyography into the study of muscular activation patterns during different phases of the paddle stroke contributes to the understanding of paddle biomechanics. The interplay between physiological factors and SUP performance requires a continued focus on investigating the aerobic and anaerobic capacities of practitioners at different skill levels. Additionally, monitoring HR, anaerobic threshold, and energy expenditure during SUP provides insight into how these physiological factors relate to performance. A more complete understanding of how the physical and technical aspects interact can be achieved by correlating biomechanical, sEMG, and GPS data. Continued improvements in board and paddle materials and design may result in improved performance for practitioners. Ergonomics and technical evaluation of equipment play an equally important role, providing insight into force generation during paddling and the reliability of different types of equipment. From a safety perspective, research into preventative measures and understanding ocean conditions is essential. As SUP grows in popularity, research must also address its environmental impact, with a particular focus on coastal erosion and mitigation methods.
CONCLUSION
Overall, this review provides a comprehensive and extensive consolidation of current knowledge in areas such as anthropometry, biomechanics, and physiology related to SUP performance, shedding light on key parameters and their implications for practitioners and the sport itself while also highlighting emerging trends. This analysis includes several studies on SUP performance, including differences in performance between different groups of athletes, paddling techniques, exercise intensity, and equipment used. The studies reviewed suggest that SUP athletes have higher levels of muscle mass and lower levels of body fat and use a more efficient SUP stroke, resulting in greater overall efficiency. In addition, the evaluation of SUP equipment technology, such as boards, paddles, and fins, has shown significant differences in performance based on material and design. In SUP, it is important to control the pace in order to maintain an appropriate level of intensity throughout the race. The use of ergometers and specific biomechanical and physiological analysis devices can help to understand the variables that affect performance and facilitate the design of equipment to modify them. Ultimately, these studies demonstrate the potential for technology and innovation to improve the sport of SUP. The importance of the stability of the human SUP system in different water conditions and the need for further research to improve performance and expand the culture of experimentation within the sport should be emphasized.
ETHICAL APPROVAL INFORMATION
No Ethical approval was necessary to present this systematic review.
FUNDING
This work was supported by the Portuguese Foundation for Science and Technology (FCT), I.P., project number UIDB/04045/2020.
DISCLOSURE STATEMENT
The authors report that they have no competing interests to declare.
ACKNOWLEDGEMENTS
Declared none.
SUPPLEMENTARY MATERIAL
PRISMA checklist is available as supplementary material on the publisher’s website along with the published article.