All published articles of this journal are available on ScienceDirect.

Smartpaddle® as a New Tool for Monitoring Swimmers’ Kinematic and Kinetic Variables in Real Time
Authors Info & Affiliations
Abstract
Background:
Smart technology, such as wearables, applied to sports analysis is essential for performance enhancement. New technological equipment can promote the interaction between researchers, coaches, and athletes, facilitating information exchange in real time.
Objective:
The aim of this study was to present new wearable equipment (SmartPaddle®) to measure kinematic and kinetic variables in swimming and understand the agreement of the propulsive force variable with a pressure sensor system.
Methods:
Four male university swimmers (18.75±0.50 years old, 71.55±6.80 kg of body mass, and 175.00±5.94 cm of height) were analyzed. The SmartPaddle® and a pressure sensor system were used to collect the kinetic data (propulsive force). The comparison between the propulsive force methods was based on t-test paired samples, simple linear regression, and Bland-Altman plots.
Results:
SmartPaddle® is a system that consists of (i) a wearable device, (ii) the Trainesense Session Manager mobile application for recording, and; (iii) the Analysis Center for analysis and data storage. It records a set of kinematic and kinetic parameters useful for coaches daily. The comparison between the different methods revealed non-significant differences and a very-high relationship.
Conclusion:
SmartPaddle® is a feasible wearable device that swimmersswimmers can use can use to provide immediate data about their kinematic and kinetic profile. Coaches can easily monitor these parameters and give immediate suggestions to their swimmers on a daily basis.
1. INTRODUCTION
In sports, athletes spend a limitless amount of time improving their technical abilities to perform at their best in major competitions. Their level of performance may also depend on the detailed information they receive from their coaches and sports analysts during training and competition [1]. Such information is usually provided to coaches by sports analysts and researchers [2, 3]. However, data collection can be a time-consuming and complex process. Often, delivering the information takes some time to reach the athlete.
The use of smart technology applied to sports analysis has been essential for researchers, clinicians, practitioners, and athletes. Indeed, new technological equipment can facilitate the interaction between researchers, coaches, and athletes [4]. For instance, inertial measurement units (IMU’s) are a less time-consuming, non-invasive, and practical alternative to the video-based methods used by researchers to analyze human motion [5]. Moreover, this equipment detects several parameters during exercise with a higher precision [6] and due to the sensor compactness, multiple applications may be used in exercise/sports movements [7].
In swimming, the main aims of studies related to this topic are (i) the validation of accelerometers and; (ii) the measurement of the specific kinematics and motion analysis related to swimming [5, 8, 9]. The validation process depends on two main factors inherent to the aquatic environment, sealing and the hypothetical drag caused by the sensor. Such studies have noted that water-based exercises (such as swimming) require the sensors to be hermetically sealed, making them water-resistant/proof. Technological development has also reduced the sensors' size, which can be a great advantage for their use in the water environment due to drag [10]. Moreover, the sensor must be placed in a body segment that: (i) does not increase drag; (ii) does not bother the individual actions, and; (iii) does not limit the athletes’ motion [11].
Regarding the specific kinematics measurement and motion analysis, studies have shown that wearable sensors can substantially complement coaches [12, 13]. Most of the time, swimmers use equipment to collect data, which must be exported and analyzed by researchers. On the other hand, there are wearables that can be used by swimmers allowing the extraction of important parameters for swimming (e.g., swim velocity, stroke count, distance per stroke, body balance, stroke index) and providing immediate feedback to coaches about the swimmer’s performance when using the device [5, 12]. However, to the best of our knowledge, no wearables measure the propulsive force in swimming. There are systems that measure propulsive force, but these require cabling and data exportation for further analysis [14-16]. Considering that this is a parameter of substantial importance, as it is strongly related to swimming velocity [17], one can argue that providing swimmers with immediate feedback about their in-water force can improve performance.
Therefore, the aim of this study was to (i) present new wearable equipment (SmartPaddle®) to measure kinematic and kinetic variables in swimming that can give immediate feedback to coaches and; (ii) understand the agreement of the propulsive force variable with a pressure sensor system.
2. MATERIALS AND METHODS
2.1. Participants
The sample was composed of four male university swimmers (age: 18.75 ± 0.50 years, 71.55 ± 6.80 kg of body mass, 175.00 ± 5.94 cm of height, and 67.69 ± 4.01 s at the 100 m freestyle in short-course meter) with more than six years of competitive experience. The swimmers signed an informed consent form. All procedures were in accordance with the Declaration of Helsinki regarding human research, and the Politechnic Ethics Board approved the research design.
2.2. Experimental Design
This was a cross-sectional study. In-water warm-up and trial performance took place in a 25 m indoor swimming pool (water temperature: 27.5º C; air temperature: 26.0º C; relative humidity: 67%). Following a standardized 1,000 m warm-up, each swimmer completed one all-out trial of 25 m front crawl with a push-off start. Swimmers concurrently used two equipment to measure propulsion, which were synchronized based on the hand entry and exit. A set of stroke kinematic and kinetic variables was measured via assessment of the number of stroke cycles needed to cover the intermediate 15 m of the swimming pool.
2.3. Data Collection with SmartPaddle®
SmartPaddle® (Trainesense Oy, Tampere, Finland) is a wearable sensor that measures force, velocity, and orientation of the palm of the hand during a swimming stroke. It consists of three parts: the SmartPaddle® sensor, the Trainesense Session Manager mobile application for recording, and the Analysis Center (https://login.trainesense.com/) for analysis and data storage. The SmartPaddle® sensor unit is attached to the swimmer’s hand with silicon straps. It records the applied force using two pressure sensors and movement with 9-axis IMU. The device uses a sampling frequency of 100 Hz. It has a memory capacity to record 40 minutes uninterrupted. The wirelessly charged battery provides an operating time of 33 hours. The Trainesense Session Manager is a user interface between a mobile device and the SmartPaddle®. It is used to manage the recording and to upload the data to the Analysis Center. The Analysis Center automatically analyses the recordings and visualizes the performance. The Analysis Center primarily provides instantaneous information for coaching the athletes in the training environment. Furthermore, it also allows downloading the data for further processing. It must be mentioned that the SmartPaddle® algorithm has not been published. It generates the processed data via the closed Matlab GUI (Graphical User Interface) (Tampere, Finland) developed by Trainesense Oy (Tampere, Finland). Thus, users have no access to SmartPaddle® raw data, and the algorithm cannot be adjusted.
2.4. Data Collection with Pressure Sensors
Differential pressure sensors and underwater video (Aquanex + Video, Swimming Technology Research, USA) were used to measure the in-water force (f=100Hz) [18]. Such sensors were placed between the third and fourth metacarpals to measure the pressure differential between the palmar and dorsal surfaces. This location is considered a good proxy of the application point of the thrust vector in hand [19]. At the beginning of each trial, swimmers were asked to keep their hands underwater at the waistline for 10 seconds to calibrate the system with the hydrostatic pressure values. The video camera was placed on the side of the swimming pool, recording the swimmers on the sagittal plane. The sensors were connected to an A/D converter connected to a laptop on the pool deck with the Aquanex software (Aquanex v. 4.2 C1211, Richmond, USA) [18]. Afterwards, time-force series were imported into signal processing software (AcqKnowledge v. 3.9.0, Biopac Systems, Santa Barbara, USA). The Signal was handled with Butterworth fourth-order low-pass filter (cut-off: 5Hz). For each dominant and non-dominant arm-pull, the mean thrust (Fmean_dominant and Fmean_non-dominant, N) was measured.
2.5. Statistical Analysis
The Shapiro-Wilk and Levene tests were used to test the assumptions of normality and homoscedasticity, respectively. The mean plus one standard deviation was computed as descriptive statistics. Comparative analysis between the pressure sensors and the SmartPaddle® included: (i) mean data comparison; (ii) simple linear regression between values, and; (iii) Bland Altman plots [21]. For the mean data comparison, the student’s t-test paired samples (p ≤ 0.05), the mean difference with a 95% confidence interval (95CI), and the magnitude of the effect size (Cohen’s d) were computed. The effect size index was interpreted as: (i) small if d < 0.2; (ii) moderate if 0.8 > d ≥ 0.2 and; (iii) large if d ≥ 0.8 [20]. Simple linear regression models between pressure sensors and paddles were computed. Trendline equation, determination coefficient (R2), adjusted determination coefficient (Ra2), standard error of estimation (SEE), and 95% of confidence (95CI) and prediction (95PI) intervals were calculated. As rule of thumb and qualitative interpretation, the relationship was defined as: very weak if R2 < 0.04; weak if 0.04 ≤ R2 < 0.16; moderate if 0.16 ≤ R2 < 0.49; high if 0.49 ≤ R2 0.81 and; very high if 0.81 ≤ R2 < 1.0 [21].
The Bland Altman analysis included the plots of the pressure sensors' mean value versus the SmartPaddle® [22]. A bias of ± 1.96 standard deviations of the difference was adopted as the limit of agreement. For qualitative assessment, the analytical modeling data was considered valid and appropriate if at least 80% of the plots were within the ± 1.96 standard deviation of the difference (95CI).
3. RESULTS
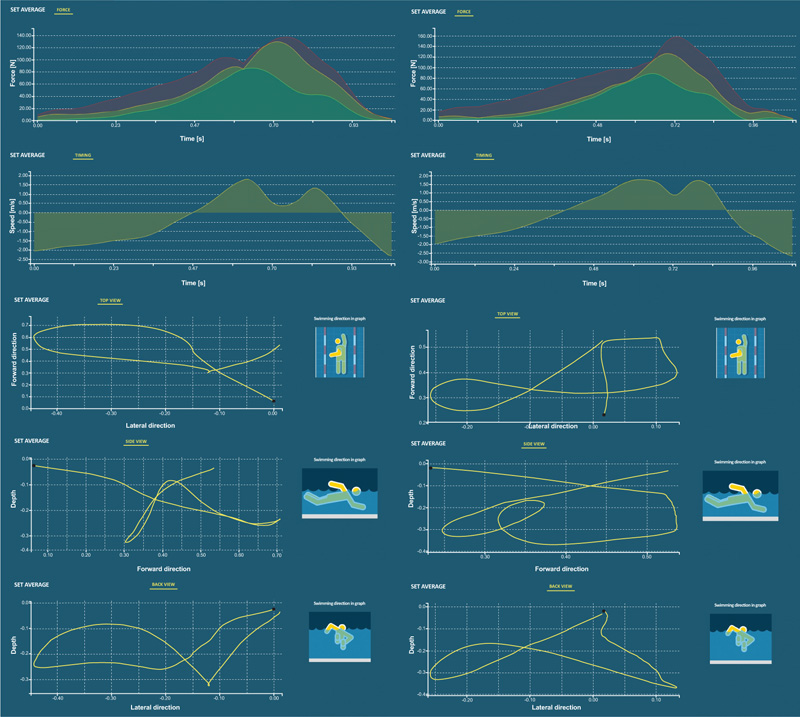
Fig. (1) depicts the trial average of the force, timing, top view, side view, and back view of the SmartPaddle®. It can be observed that both hands presented a similar force and timing pattern. However, visual inspection denotes different patterns between hands in the forward, side, and back views.
| - | Swimmer A | Swimmer B | Swimmer C | Swimmer D | Mean±1SD |
|---|---|---|---|---|---|
| Fmean_right_sensors [N] | 38.65±3.67 | 29.55±4.29 | 36.22±4.62 | 37.14±2.02 | 35.05±5.22 |
| Fmean_left_sensors [N] | 39.13±2.93 | 32.51±2.82 | 29.20±3.05 | 36.20±2.55 | 34.30±4.70 |
| Fmean_right_paddles [N] | 39.07±3.06 | 29.41±4.92 | 35.58±4.77 | 35.01±1.91 | 34.50±5.28 |
| Fmean_left_paddles [N] | 37.86±2.12 | 33.06±3.40 | 27.98±3.04 | 36.31±2.30 | 33.83±4.65 |
Table 1 presents the descriptive characteristics of the swimmers who participated in the study. It also shows the average force values (for each hand) retrieved from the SmartPaddle® and pressure sensors during each swimmer’s trial. Paired comparison (i.e., SmartPaddle®vs pressure sensors) revealed non-significant differences between equipment (mean difference = -0.515, 95CI: -1.063 to 0.032, t = -1.882, p = 0.065, d = 0.10).
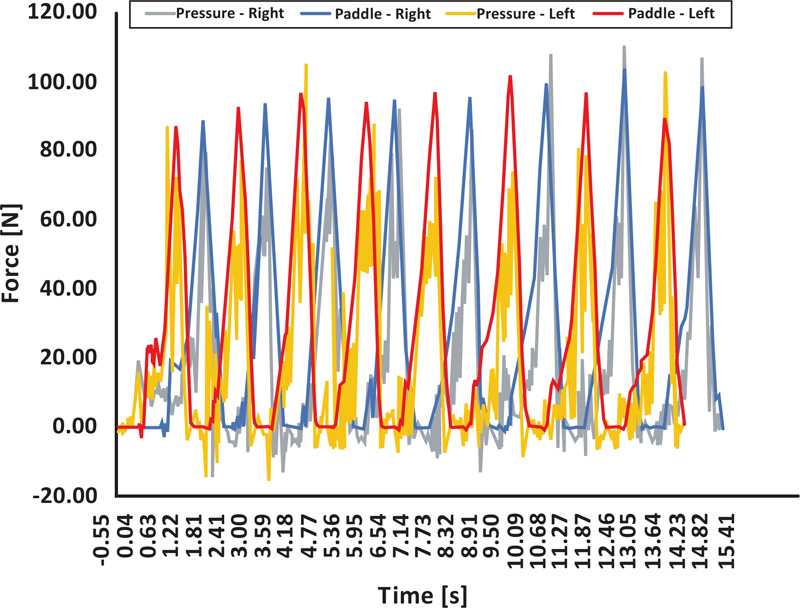
Fig. (2) depicts an example of a swimmer’s paired sampling (force-time curve) between the data acquired with the SmartPaddle® and pressure sensors.
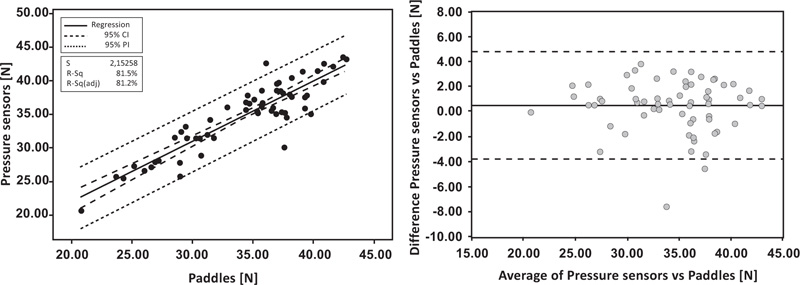
Fig. (3) presents the standardized linear regression and Bland Altman plots between the SmartPaddle® and pressure sensors. A very-high relationship was noted (R2 = 81.5%, Ra2 = 81.2%, p < 0.001). The Bland-Altman analysis showed that more than 80% of the plots for all variables were within the 95CI agreements.
4. DISCUSSION
The aim of this study was to present the SmartPaddle® and understand the agreement of the propulsive force measured with the paddles and with a pressure sensor system. SmartPaddle® combines a wearable-software interface that presents a set of kinematic parameters as well as the magnitude, direction and timing of the force produced by the hand strokes. The three criteria used to assess the agreement between the propulsive force measurement methods were accomplished.
Nowadays, the real-time information athletes receive is essential to improve performance [1, 23]. Besides training volumes and intensities, coaches usually focus on swimming technique to improve swimming speed and, hence, the swimmer’s performance [24]. The most common variables to control swimming speeds are the stroke frequency and length [25]. Some studies indicate the use of wearable sensors to provide this information to coaches and swimmers in real time [5, 12]. However, little is known about the propulsive force that swimmers can produce during the stroke cycle. It was shown that propulsive force is a key-factor in swimming [17, 26]. At front crawl, Morais et al. [17] showed that a higher propulsive force measured independently in each upper limb led to a faster swimming speed. Nonetheless, the systems used to measure propulsive force are more aimed at researchers than coaches. The latter may find these systems complex and time-consuming.
Additionally, the information cannot always be delivered in real-time. Such systems often need to export and handle data independently. Thus, real-time equipment that can deliver instant feedback to coaches and swimmers is essential. Indeed, it has been claimed that real-time augmented feedback can improve swimmers’ technique and performance [23, 27].
As aforementioned, SmartPaddle® is a system that consists of: (i) a wearable sensor, (ii) the Trainesense Session Manager mobile application for recording, and; (iii) the Analysis Center for analysis and data storage. Besides the lap time, stroke frequency and stroke length, the SmartPaddle® also measures other parameters related to the propulsive force. The force information is calculated from data provided by the pressure sensors and the 9-axis IMU in which the propulsive force, impulse, hand velocity, and trajectory are calculated as well. Essentially, force information quantifies and visualizes the feel of water, which is otherwise very difficult to explain to the athletes. SmartPaddle® measurements allow a comprehensive view of how the produced force influences the swimmer’s performance. Moreover, as the test data is stored in the Analysis Center, it is possible to follow up on the swimmer's development and compare the technical performance of different athletes. The literature on this topic acknowledges that this kind of information is of paramount importance for coaches and swimmers [28, 29]. Overall, swimmers produce different amounts of propulsive force based on different stroke frequencies, hand’s path and pitching angles, and phase of the stroke cycle [28, 29]. Thus, it allows the identification with immediate feedback of the swimmer’s hand pattern, at a given stroke frequency and the amount of propulsive force he/she is generating during the stroke cycle, which is valuable information for coaches and swimmers.
The literature reports a wide variety of equipment that measures propulsive force in swimming, which can be based on pressure sensors [16, 17] or IMU’s [8, 30]. Nonetheless, there is no gold-standard method to measure propulsive force. All these methods have advantages and limitations [11]. Our data related to the agreement between the different equipment to measure the propulsive force indicates non-significant differences and a very-high relationship between methods (i.e., SmartPaddle® vs a pressure sensor system). Both methods acquire the propulsive force independently in each upper limb. Thus, the paired data was based on the comparison of the propulsive force measured in each upper limb with both methods. Non-significant differences were verified between methods, and a very-high relationship was observed. This indicates that whenever the propulsive force tends to increase measured by one method, it also increases with the other method.
Moreover, the Bland-Altman plots also demonstrated a good agreement between methods. The authors would like to highlight that their aim was not to validate any method but rather to indicate that, regardless of the method used, a non-significant difference is observed. This suggests that both methods measure the same phenomenon. However, as already mentioned, some systems are quite difficult for coaches to handle due to their complexity: cable handling, data treatment, or time-consuming. The pressure sensors such as the ones used in the present study can be included in these systems. Conversely, the SmartPaddle® has proven to be a more coach-friendly system that provides real-time kinematic and kinetic information for coaches.
It must be mentioned that swimmers who participated in this study were Tier 2 athletes [31]. Their swimming level and training experience allowed them to not compromise data collection (i.e., poor swimming technique). Moreover, they were used to wear both equipment which also eliminated a hypothetical bias due to mechanical constraints. As main limitations, one can consider: (i) the low sample size used. Notwithstanding, 35 stroke cycles with each piece of equipment were analyzed; (ii) other variables could be used to give deeper insights about the agreement of this kind of equipment, such as the impulse and peak values, and; (iii) despite not being a validation study (and it should be mentioned that no gold-standard method exists to measure propulsive force in swimming) this equipment could also be compared with video-based analysis to use another approach for testing the level of agreement. Moreover, it must be pointed out that overall, users have no access to SmartPaddle® raw data and the algorithm cannot be adjusted.
CONCLUSION
SmartPaddle® is a wearable device that measures a set of kinematic and kinetic parameters in a real-time context. These are parameters that coaches commonly use daily, in addition to propulsive force, a parameter less monitored in a training context. Moreover, the propulsive force data presented non-significant differences and a very-high agreement with other apparatus that measure propulsive force. Through SmartPaddle®, coaches can monitor in real time a set of parameters that play a key factor in swimming performance and can provide their swimmers with immediate information about such parameters.
LIST OF ABBREVIATIONS
| IMU’s | = Inertial Measurement Units |
| CI | = Confidence Interval |
| SEE | = Standard Error of Estimation |
ETHICS APPROVAL AND CONSENT TO PARTICIPATE
This study was approved by Polytechnic Institute of Bragança Ethics Board affiliated with Polytechnic Institute of Bragança Portugal with the approval number: No. 72/2022.
HUMAN AND ANIMAL RIGHTS
No animals were used for studies that are the basis of this research. All the humans were used by the ethical standards of the committee responsible for human experimentation (institutional and national), and with the Helsinki Declaration.
CONSENT FOR PUBLICATION
The swimmers signed an informed consent form.
STANDARDS OF REPORTING
STROBE guidelines were followed.
AVAILABILITY OF DATA AND MATERIALS
Not applicable.
FUNDING
This work is supported by national funds (FCT - Portuguese Foundation for Science and Technology) under the project UIDB/DTP/04045/2020.
CONFLICT OF INTEREST
The authors declare no conflict of interest, financial or otherwise.
ACKNOWLEDGEMENTS
Declared none.