All published articles of this journal are available on ScienceDirect.

Effect of Socio-demographic Factors and Physical Exercise Training on Cardiovascular Health: Case Study of Fresh Students of Babcock University Ilishan-Remo, Ogun State, Nigeria
Authors Info & Affiliations
Abstract
Introduction:
Sedentary behavior and lack of physical exercise are one of the strongest risk factors for many chronic diseases and conditions, including cardiovascular disease, hypertension, diabetes, obesity, osteoporosis, colon cancer, and depression. Hence, the aim of this study was to assess the combined and relative effect of socio-demographic characteristics and physical exercise (PE) training on the cardiovascular health of freshmen of Babcock University, Ilishan-Remo, Ogun State, Nigeria.
Methods:
The study was a quasi-experimental study that employed both qualitative and quantitative methods of data collection. An all-inclusive sampling method was used to select all 72 volunteers for a pre-exercise medical evaluation, and questionnaires were administered to 600 volunteers for pre and post-data. The respondents were treated with a six-week dose of regular daily selected physical activities. The post-test was conducted, recorded, and subjected to statistical analysis using inferential statistics.
Results:
The mean age was 18±1.89 with the age of 17 forming the largest group, i.e., 218 (36.3%). Females, 379(65.2%), were slightly more than their male counterparts, 221 (36.8%). The results of pre-exercise showed that some, 9 (12.2%), had normal body temperature. The respondents who were obese and over-weighted were 25 (33.8) and 20 (27.1), and respondents with high mean arterial pressure were 15 (20.3), respectively. The mean arterial pressure (MAP) of the respondents tested showed no significant difference (P>0.05) between the mean age, sex and marital status with respect to the blood sugar level, body temperature and the body mass index. MAP and irregular participation in physical activities were significant (P<0.05) among this group of students. The knowledge mean score (KMS) of 19.37±6.035 was high compared to a 27-point scale. There was no significant relationship between df=2, F=1.566 and P>0.005. Some, 160 (26.7%), had excellent overall physical health, and 173 (28.8%) had good overall physical health. There were significant interactional effects (F= 59.276, mean score within group 1.60, df 2, p = .000, R = -282) between groups and time for perceived benefits, interpersonal norms, social support, counter heart conditioning, stimulus control, and overall time spent on being physically active per week.
Conclusion:
In conclusion, a correlation was observed between the predictive factors and cardiovascular diseases; it was recommended that all students should be encouraged to engage in regular PE at a level appropriate to their capacities, needs, and interests to maintain optimal cardiovascular health status.
1. INTRODUCTION
Sedentary behavior is one of the strongest risk factors for many chronic diseases and conditions, including cardiovascular disease, hypertension, diabetes, obesity, osteoporosis, colon cancer, and depression [1]. It has been found that involvement in physical activities may significantly reduce other risk factors for atherosclerosis. The World Health Organization 2020 issued the same statement in the wake of the global pandemic of COVID-19 that physical exercise is necessary during the lockdown as this may reduce other risk factors for atherosclerosis (e.g., blood lipid abnormalities and elevated blood pressure levels) [1], and thereby decrease the risk of macrovascular or atherosclerotic complications of diabetes [2], [3].
Initial studies found increased severity of coronavirus disease 2019 (COVID-19) [4], caused by infection with severe acute respiratory syndrome coronavirus 2 (SARS-CoV-2), in patients with diabetes mellitus. Furthermore, COVID-19 might also predispose infected individuals to hyperglycemia [5]. Many researchers have opined that regular physical activity decreases the risk of cardiovascular disease mortality [3, 4] in general and of coronary heart disease mortality in particular [3, 5, 6]. Hence, it was advised to prevent such complications among patients with diabetes mellitus who are at risk of SARS-CoV-2 infection and that they should try not to be sedentary for long periods, as regular physical activity is associated with decreased incidence of thromboembolism [4, 7]. Instead, these individuals should try to engage in physical activity to improve blood circulation [8].
College students, generally late adolescents (who are in the age of transition from childhood into self-sufficient adulthood), go through many physical and mental changes that may have positive and negative influences on their lives [5]. It is observed that participation in regular physical activity during this transitionary period assists college students in coping with stress, aiding their transition into self-sufficient adulthood [9]. This is more necessary as physical activity/physical exercise (PA/PE) rates tend to decline precipitously during the secondary school years, leading to low physical activity and exercise (PA/PE) among undergraduate and college males and females [10, 11]. Prevalence rates show that adolescent girls are less active than boys [12, 13], and that activity declines more precipitously among girls during adolescence [12, 14]. There are many socio-demographic and cultural factors, such as age, marital status, income, diet/food/meal pattern, socio-cultural factors, technology and social affluence [15] that could predispose adolescents to lack of participation in PA/PE and could finally predispose the individual to develop health problems, including cardiovascular diseases.
Approximately one-third of children in Nigeria are overweight or obese. It has been observed [6, 16] that there is also a trend of low involvement of college students in physical activities, which may lead to obesity [17]. Children (particularly adolescents) need a positive behavioral change toward weight control, as obese individuals may also suffer
from social stigmatization, discrimination [7], and lower self-esteem [8]. Overweight and obesity (including childhood obesity) substantially raise the risk of illnesses, including high blood pressure, high cholesterol, type 2 diabetes, heart disease, stroke, gallbladder disease, arthritis, sleep disturbances, cardiovascular disease, hypertension, osteoporosis, colon cancer, depression [9], and certain types of cancers [8].
Regular physical activity and physical fitness contribute to one’s overall health [14], sense of well-being [12], and maintenance of healthy body weight [15]. Participation in PA/PE also promotes long-term health and well-being [16], [17], reducing the risk of obesity and type 2 diabetes among young people [8, 18, 19]. However, only a few adopt physical exercise as a means of promoting health [19-20]. Due to low or no involvement in PA/PE, the prevalence of obesity is increasing at an alarming rate among young people [20, 21]. Because of an increase in the drop rate of participation in PA/PE, the adolescents are advised to spend at least 30 minutes of moderate activity on five [10] or more days per week or twenty minutes of vigorous activity three or more times per week [22, 23]. It has been recommended that an appropriate exercise program is added to the diet or drug therapy that will improve blood glucose control and reduce certain cardiovascular risk factors among persons with diabetes [11, 24, 25]. The undergraduates may not know that they are at risk of such diseases as diabetes [11, 17, 20], high blood pressure, arteriosclerosis, arthritic situations, and burden of cardiovascular diseases, or invariably if they are at a high risk of total breakdown from these debilitating diseases [26], or associated diseases if proper care is not taken [26].
The World Health Organization [1, 8] states that exercise training may reduce other risk factors for atherosclerosis (e.g., blood lipid abnormalities and elevated blood pressure levels). PA helps decrease the risk of macrovascular or atherosclerotic complications of diabetes [14]. Lastly, physical activity may prevent or delay the onset of non-insulin-dependent diabetes mellitus (NIDDM) [24, 27, 28] by reducing total body factors, specifically intra-abdominal fat, a known risk factor for insulin resistance [20]. Physical activity is inversely associated with obesity [29] and intra-abdominal fat distribution, and recent studies have demonstrated that physical training can reduce these body fat stores [25, 30]. Much of the effect of physical activity appears to be due to the metabolic adaptation of skeletal muscle. However, exercise training may contribute to improved glucose disposal and glucose-insulin dynamics in both adipose tissue and the working skeletal muscles. Diet and exercise have been found to be most effective for controlling NIDDM in persons who have mild disease and are not taking medications [12, 25, 26]. There is a need to assess the predictive factors (socio-demographic factors) affecting involvement in PA, the time spent on it, the intensity and involvement in sustained participation in physical activities/exercises of the freshmen of Babcock University in order to improve the general wellbeing, wellness and health status of the students and militate against cardiovascular diseases. Hence, this study assessed the effects of socio-demographic factors and physical exercise training on cardiovascular health by carrying out a case study of fresh students of Babcock University Ilishan-Remo, Ogun State, Nigeria.
2. MATERIALS AND METHODS
2.1. Study Design
The study design adopted was one-arm quasi-experimental testing and control. It aimed at investigating the effects of two independent variables, the correlation of socio-demographic factors and physical exercise training, on cardiovascular performance and health status among 600 freshmen at Babcock University.
2.2. Sample Size and Sampling Technique
An all-inclusive simple sampling method was used in selecting the first-year undergraduate students for the study; the result of a sample size calculation used to determine the N size for the population was expected to use a total number of two hundred and seventy-six (N=276); however, the researcher considered using the largest estimate, hence, all the participants who volunteered were finally included in the study. This, however, allows for possible attritions and unforeseen circumstances in case of drops, as experienced in this study. All of the 600 first-year undergraduate students who volunteered to participate in the intervention were included in the study. Therefore, a three-phase simple random sampling technique was used in selecting the participants for the study.
2.2.1. Phase 1
The researcher reiterated the importance of the study to the participants and sought their informed consent that the study will take up to more than 12 weeks; hence, only those who volunteered were included in the study. The researcher went around the classes to make an open call to the freshmen to volunteer.
2.2.3. Phase 3
A simple random sampling was used to select participants for the experimental group, and the same process was done while selecting the control group on a different campus of the same university. The control group was on a different campus located in a different town/location.
The experimental group (EG) was given a treatment package of a six-week physical exercise training while the control group was given or treated with a placebo of a series of counseling on academic achievement and empowerment skills. This was done to compensate the participants in the control group.
2.3. Data Collection Instrument
The study employed both qualitative and quantitative data collection methods. These included a pre-exercise medical evaluation and survey within six weeks among the respondents. The pre-exercise medical evaluation that was collected at the baseline and the post-exercise intervention included vital signs and anthropometric measurements of the respondents. So, the study employed a validated questionnaire for the study, which was pretested, and the reliability test was 0.737 at Cronbach’s alpha; this confirmed its high degree of reliability.
At the baseline, the data collected before the intervention included anthropometric measurements, such as weight and height, which were used to calculate the BMI and the vital signs, including the pulse rate, temperature, and blood pressure assessment. All measurements were conducted to nearest 0.1 cm, and body mass was conducted to nearest 0.1 kg. Students’ measurements were conducted without footwear whilst wearing minimal clothing (trousers/skirt, shirt). In order to determine whether the participants have normal weight, are overweight or obese for their age using international cut-off points, the measurements of body mass and stature were used to determine each student's BMI [31]. The BMI was calculated using the formula as follows: weight (kg)2/height (m)2. Cautions were taken during other measurements, like the BP and the pulse rate, using an electronic sphygmomanometer. The blood sugar and the body temperature as well as the mean arterial blood pressure were used to determine the health status of the volunteered respondents. These measurements were indicators of susceptibility to any of the cardiovascular diseases.
The measurements were taken by the 4 qualified nurses recruited as the research assistants, and they were further trained by the researcher on the ethics and modality of the study. Furthermore, 10 peer trained spotters/supporters were recruited and were given thorough and adequate training to handle the volunteers both in the demonstrated physical exercises and recording of data and vital signs. The quantitative method employed the use of a questionnaire that was pre-tested, and the reliability test was 0.737 at Cronbach’s Alpha; this confirmed its high degree of reliability. All the respondents participated in planned physical exercise and physical activities daily for 6 weeks (Appendix I ). The exercises were flexible and varied per week to create fluidity and varieties were duly graded to carry the same frequency and intensity within the stipulated time. This was done to reduce the monotony of doing the same thing every time, especially when the immediate and long-time outcome was to first see the effect of the PA/PE on the respondent's cardiovascular performance and help the participants to form a habit of exercise. The physical activities were rated as slightly low to moderate. The cumulative period of participating in a low to moderate PA/PE was maintained for 20 minutes per day with the same intensity as exercises within the stipulated time for6 weeks of adherence to the determined activities (Appendix I).
The research assistants and sporters (sporting assistance/guide) monitored the physical exercises, and the activities and exercise logs were adequately recorded; these included the bio-demographic characteristics, heart rate, BP, weight, height, and hip and waist circumferences. The data were collected at baseline and at the 12th week, through pre-exercise medical evaluation, and only volunteered students for the pre-exercise testing were tested. The survey and the intervention were within six weeks in which the participants were treated with light to medium physical exercise. All volunteers were included in the study.
2.4. Pre- and Post-Test Assessment
The post data collection was done at the end of the 12th week; there was observed a drop in the total number of participants who were unavoidably absent because of the semester break. Hence, the results of the remaining 72 respondents were used for determining the respondents’ cardiovascular health.
2.5. Statistical Analysis
The data collected were analyzed using a statistical package [31] to facilitate data entry and analysis. The data collected through the questionnaire were analyzed using both descriptive and inferential statistics [32]. Data analysis involved the use of Pearson product-moment correlation and multiple regression analysis to seek possible predictive capacity of the independent variables and the dependent variable, and other inferences were drawn using ANOVA.
3. RESULTS
3.1. Sociodemographic Characteristics as Predictors of Cardiovascular Diseases
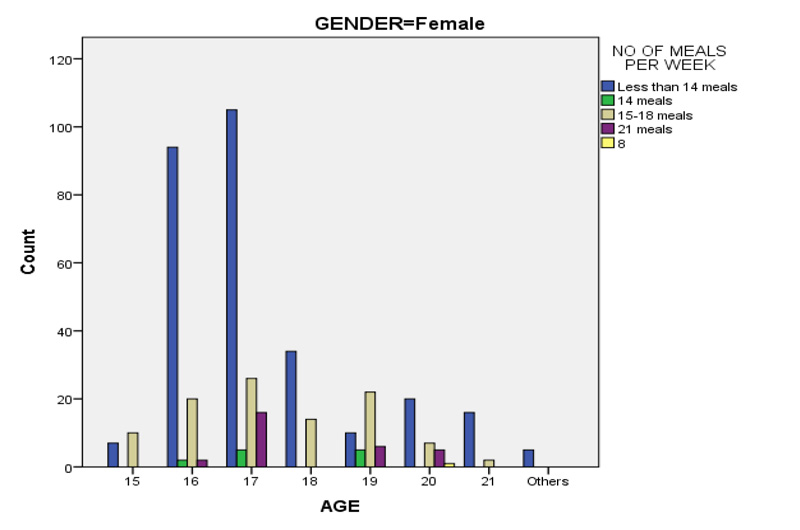
Actual age was used for the freshmen of Babcock University since the age range was in a cluster of 15 years old to 21 years old, forming the category of the students in the study. 147 (24.5%) students were aged 16; this subset formed the second largest group of the study. The largest actual age that formed the largest group was 17 years, which included 218 (36.3%) participants; this implies that undergraduate students nowadays fall mostly within the age range of 16 to 19 years. Female students, i.e., 379 (65.2%), more volunteered to participate in the study than their male counterparts, i.e., 221 (36.8%) (Table 1). The table shows that only a few, 8 (1.3%), of the respondents were married, while the majority, 591 (98.5%), were not married, and just only 1 (0.2%) divorced. Table 1c below shows that many respondents, 273 (45.5%), had less than 14 meals, which means the respondents ate less than two meals per day; some, 84 (14%), had 14 meals; some, 154 (25.7%), had between 15-18 meals, while some, 88 (14.7%), had 21 meals. This means that the students ate seldom.
The sleeping patterns of the respondents have been recorded in the same table. Table 1 below shows that 157 (26.2%) of the respondents slept for less than 4 hours in the pre-test. This was also tested at the end of the study at the post-test. The results post-test presented a decrease of 117 (19.5%) among the respondents who slept for less than 4 hours. Some, 260 (43.3%), of the respondents usually slept for less than 6 hours in the pre-test, and there was a marginal increase of 293 (48.8%) of respondents in the post-test. Many, 162 (27%), slept for 8 hours in the pre-test, and there was a decrease of 152 (25.3%) respondents in the post-test. Only 2.5% slept for 10 hours in the pre-test, and there was a marginal increase to 6.3% of respondents in the post-test. The students who were not able to sleep for very long hours showed a lacking in their physical activities since there was no sound sleep.
There was no relationship observed between those being married and participating in PE, P=.549, but there was a significant relationship found in being single and carrying out PE, P<0.000. There was a linear-by-linear association was found between age, sleep, and gender; p< 0.000 (Table 1a).
| Variables | Pre | Post | |||
| Freq | % | Freq | % | ||
| Age | 17 | 218 | 36.3 | ||
| 16 | 147 | 24.5 | |||
| 18 | 100 | 16.7 | |||
| Others above 21 | 51 | 8.5 | |||
| 19 | 39 | 6.5 | |||
| 20 | 28 | 4.7 | |||
| 15 | 11 | 1.8 | |||
| 21 | 6 | 1.0 | |||
| Gender | Female | 379 | 63.2 | ||
| Male | 221 | 36.8 | |||
| Marital Status | Married | 8 | 1.3 | ||
| Single | 591 | 98.5 | |||
| Divorced | 1 | .2 | |||
| No. of Meals Per Week | |||||
| Less than 14 meals | 273 | 45.5 | |||
| 14 meals | 84 | 14.0 | |||
| 15-18 meals | 154 | 25.7 | |||
| 21 meals | 88 | 14.7 | |||
| How Long Do You Sleep | |||||
| Less than 4 hours | 157 | 26.2 | 117 | 19.5 | |
| Less than 6 hours | 260 | 43.3 | 293 | 48.8 | |
| 8 hours | 162 | 27.0 | 152 | 25.3 | |
| 10 hours | 15 | 2.5 | 38 | 6.3 | |
| More than 10 hours | 6 | 1.0 | 600 | 100.0 | |
| Chi-square Test | ||||
| Sociodemographic Characteristics | Value | Df | Asymp. Sig. (2-sided) | |
| Marital status | Married | 1.200b | 2 | .549 |
| Single | 103.182c | 28 | .000 | |
| Total | 103.076a | 28 | .000 | |
| Age *sleep and *gender | Male | 38.916b | 18 | .003 |
| Female | 85.898c | 21 | .000 | |
| Age * sleep * marital status | Married | 6.000b | 2 | .050 |
| Single | 80.278c | 21 | .000 | |
| Age * sleep * gender* no. of meal | Male | 38.916b | 18 | .003 |
| Female | 85.898c | 21 | .000 | |
| Participation in PAPE before * no. of meals per week * gender | Male | 1.665b | 3 | .645 |
| Female | 1.585 | 3 | .663 | |
Table 1b below shows that there was no significant relationship between being married and other socio-demographic factors and the respondents’ health; P>0.005. However, age, gender, sleep, selection of food/type, and choice of meal as to whether eat twice a day or three times a day, exhibited a certain linear correlation, P< 0.05, as shown in Table 1b.
The effect of baseline/pre-intervention result for knowledge mean score (KMS) of physical activity behavior of the respondents on health implications was measured. The result of the post-intervention has been shown to be in line with the baseline test reports. Table 1c shows the changes in mean knowledge score, and that the outcome variables between pre- and post-test have exhibited significant interaction effects between the groups; p<0.03. The knowledge mean score at the baseline was observed to be 19.57+ 6.12, and the knowledge mean score at the post-test was reported at 21.78± 5.36 on a 27-point scale (Table 1). The result regarding the involvement of respondents in physical activities and their health showed covariate significant differences for counter conditioning, F = 59.276, with the mean score within groups as 1.60, df 2, p = .000, R = -282, and the cue to action showed an increase in the overall minutes on PE by those who said they could do PAPE (Figs. 1 and 2).

| Baseline | Post-intervention | ||||||||||
| N | Mean | Std. Deviation | Std. Error | N | Mean | Std. Deviation | Std. Error | P-value | |||
| Knowledge | 600 | 19.5700 | 6.12843 | .25019 | Total | 600 | 21.7817 | 5.36333 | .21896 | .613 | .032 |
Table 1c presents results relating to respondents’ knowledge mean score at baseline. The knowledge scores with a range of 27 were scored as below average and scores above the mean average were rated as high. The knowledge mean score for the group was 19.57±6.12. The knowledge means result showed the level of KMS to be above the average, which was high compared to a 27-point scale. There was no significant relationship observed between df=2 F=1.566 and P>0.005. A very reasonable number of respondents indicated physical exercise to play a great role in enhancing health. These results show that the freshmen have grasped the knowledge of physical exercise in order to enhance their state of health.
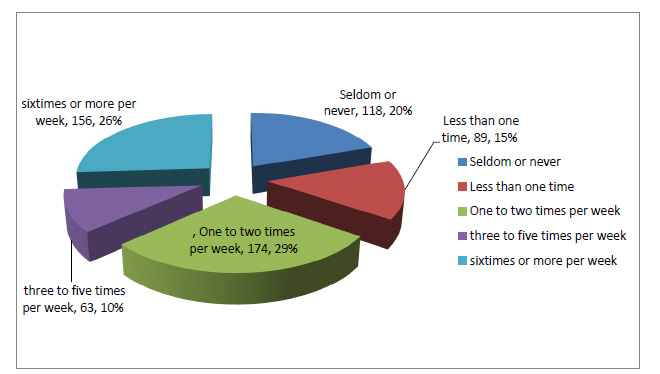
Fig. (2) below shows that some, 126 (21%), of the respondents seldom or never engaged in an exercise that increased breathing rapidly. Some, 135 (22.5%), of the respondents reported participating in PE; however, they carried out PE only one time per week. Some, 105 (17.5%), of the respondents participated in physical activities only once or twice per week; some, 201(33.5%), participated more in physical exercises that increased breathing for about three to five times per week, while a few, 33 (5.5%), of the respondents participated in PE that increased heartbeat or breathing for about six times or more per week.
4. POST-TEST
The post-test showed a significant increase in physical activities and a corresponding decrease in physical inactivity. The comparison of the participants who got involved in physical exercises that increased breathing at the baseline and the post-test indicated an increase from 105 (17%) to 174 (29%) among those who exercise one or two times per week. There was a great change observed among those who exercised six times a week or more per week, from 33(5.5%) to 156 (26.0%) (Fig. 3). The changes in outcome variables across time for the group had a significant interaction effect on the time for perceived benefits, social support, counter conditioning (an induced condition in humans in which behavior is incompatible with a habitual undesirable pattern), and overall time spent being active per week and on PA (mean minutes per day), indicating that the pre and the post results differed across time.
| Mean arterial BP group | Age of Patients | Blood Sugar | Body Temperature | Body Mass Index | |
| Low | Mean | 17.50 | 98.00 | 36.35 | 24.37 |
| N | 2 | 1 | 2 | 2 | |
| Std. deviation | 19.09 | . | .49497 | 7.10 | |
| Median | 47.50 | 98.00 | 36.35 | 24.37 | |
| % of total N | 2.8% | 2.7% | 3.0% | 3.0% | |
| Normal | Mean | 55.36 | 113.77 | 36.25 | 28.19 |
| N | 59 | 30 | 54 | 54 | |
| Std. deviation | 15.28 | 58.24 | 1.01 | 8.01 | |
| Median | 55.00 | 97.50 | 36.50 | 26.55 | |
| % of total N | 81.9% | 81.1% | 80.6% | 81.8% | |
| High | Mean | 58.27 | 114.33 | 36.50 | 27.54 |
| N | 11 | 6 | 11 | 10 | |
| Std. deviation | 9.74 | 34.03 | .73 | 3.57 | |
| Median | 58.00 | 108.00 | 36.80 | 28.37 | |
| % of total N | 15.3% | 16.2% | 16.4% | 15.2% | |
| Total | Mean | 55.58 | 113.43 | 36.29 | 27.98 |
| N | 72 | 37 | 67 | 66 | |
| Std. deviation | 14.57158 | 53.85193 | .95953 | 7.43343 | |
| Median | 55.0000 | 99.0000 | 36.5000 | 26.8150 | |
| % of total N | 100.0% | 100.0% | 100.0% | 100.0% | |
From Tables 2 above and 3, the significance at 2=tailed for all the variables in relation showed the mean arterial pressure (MAP) (classified as low MAP, normal MAP, and high MAP) to be greater than 0.05. Hence, there was no significant difference observed between the mean ages, blood sugar level, body temperature, and the body mass index of patients with low, normal, and high MAP. It could be deduced that the mean arterial pressure is not affected by the age, blood sugar level, body temperature, and body mass index of this group of students.
| Variable | Sum of Squares | Df | Mean Square | F | Sig. | |||||
| Age of respondents * Mean arterial BP group | Between groups | (Combined) | 213.29 | 2 | 106.65 | .495 | .61 | |||
| Within groups | 14862.21 | 69 | 215.39 | |||||||
| Total | 15075.50 | 71 | ||||||||
| Blood sugar * Mean arterial BP group | Between groups | (Combined) | 246.38 | 2 | 123.19 | .040 | .96 | |||
| Within groups | 104154.70 | 34 | 3063.37 | |||||||
| Total | 104401.08 | 36 | ||||||||
| Body temperature * Mean arterial BP group | Between groups | (Combined) | .638 | 2 | .319 | .339 | .71 | |||
| Within groups | 60.13 | 64 | .940 | |||||||
| Total | 60.77 | 66 | ||||||||
| Body mass index * Mean arterial BP group | Between groups | (Combined) | 30.58 | 2 | 15.29 | .271 | .76 | |||
| Within groups | 3561.05 | 63 | 56.53 | |||||||
| Total | 3591.64 | 65 | ||||||||
| S/nos | Information | Variables | Freq. | Percentage (%) |
| 1. | Gender | Male | 13 | 17.6 |
| Female | 60 | 81.1 | ||
| 2. | Blood glucose Blood sugar |
Normal | 59 | 66.2 |
| Diabetes | 8 | 10.8 | ||
| Pre-diabetes | 16 | 21.6 | ||
| 3. | Body temperature | Normal | 9 | 12.2 |
| Low body temperature | 44 | 59.5 | ||
| High body temperature | 21 | 28.5 | ||
| 4. | Body mass index | Normal | 13 | 17.6 |
| Obese | 25 | 33.8 | ||
| Underweight | 16 | 21.6 | ||
| Overweight | 20 | 27.1 | ||
| 5. | Mean arterial blood pressure (MAP) | Normal | 55 | 74.3 |
| High | 15 | 20.3 | ||
| Low | 3 | 4.1 |
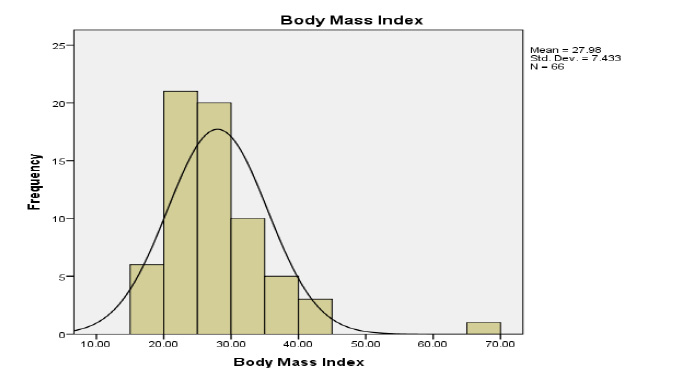
Figs. (4 and 5) show the bar chart of the body mass index and the mean arterial pressure (Table 3).
The results from Figs. (4 and 5) show a bell-shaped curve. The bell-shaped curve is normal and presents normally distributed data. Thus, the data for all the variables are normally distributed.
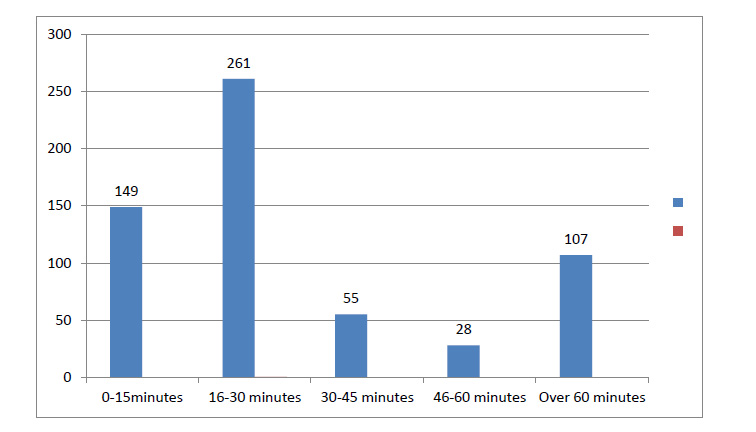
Table 4 shows the frequency of the pre-medical examined variables. The result shows that many, 25 (33.8%), were obese, those who were classified as having overweight were 20 (27.1%), 16 (21.6%) had prediabetes tendency, and the temperature was normal in 44 (59.5%), and the mean arterial pressure (MAP) was also normal in many, i.e., 55(74.3), of the respondents. Fig. (6) below shows the time spent on vigorous activities. The highest time spent was an average of 16 to 30 minutes, with 261 (43.5%) respondents.
Many, 56%, were not on a usual health maintenance drug; however, 27.5% used a drug at least once, while 14.6% said that they used a health maintenance drug at least twice or thrice. 17% of the respondents were diabetic, while only 60 (10%) were having high blood pressure, as shown in Table 5.

| Correlations | ||||||||||||||
| Items | Gender | Age of Patients | Blood Sugar | Body Temperature | Body Mass Index | Mean Arterial Blood Pressure | ||||||||
| Gender | Pearson correlation | 1 | -.108 | .098 | .190 | .273* | .050 | |||||||
| Sig. (2-tailed) | .366 | .562 | .123 | .027 | .679 | |||||||||
| Age of patients | Pearson correlation | -.108 | 1 | .019 | -.286* | .011 | .319** | |||||||
| Sig. (2-tailed) | .366 | .910 | .019 | .928 | .006 | |||||||||
| Blood sugar | Pearson correlation | .098 | .019 | 1 | .270 | -.074 | -.109 | |||||||
| Sig. (2-tailed) | .562 | .910 | .117 | .681 | .519 | |||||||||
| Body temperature | Pearson correlation | .190 | -.286* | .270 | 1 | .193 | .030 | |||||||
| Sig. (2-tailed) | .123 | .019 | .117 | .130 | .809 | |||||||||
| Body mass index | Pearson correlation | .273* | .011 | -.074 | .193 | 1 | .130 | |||||||
| Sig. (2-tailed) | .027 | .928 | .681 | .130 | .300 | |||||||||
| Mean arterial blood pressure | Pearson correlation | .050 | .319** | -.109 | .030 | .130 | 1 | |||||||
| Sig. (2-tailed) | .679 | .006 | .519 | .809 | .300 | |||||||||
| N | 72 | 72 | 37 | 67 | 66 | 72 | ||||||||
| *. Correlation is significant at the 0.05 level (2-tailed). | ||||||||||||||
| **. Correlation is significant at the 0.01 level (2-tailed). | ||||||||||||||
From Table 5 above, we can say that the effect of the combined social demographic characteristics and physical exercise showed a weak positive correlation between the gender and the BMI of the patients as the r-value was 0.273 and p=0.027 at 0.05 level (2-tailed). P-value was less than 0.05, so there existed a correlation. There was a weak negative correlation obtained between the ages of patients and their body temperature as the r-value was -.286 and p-value was 0.019, and it was significant at the level of 0.05 (2-tailed). There was also a weak positive correlation obtained between the ages of the patients and their mean arterial blood pressure as the r-value was 0.319 and p=0.006 at 0.01 level (2-tailed).
Table 6 above shows the respondents’ parental health status. The table shows the social determinants of health, which are a predisposing factor to the possibility of developing certain genotypic characteristics being transferred from parent to their offspring. The result is an indicator of the futuristic probability of possible susceptibility to cardiovascular diseases, as reported by the respondents. The result showed many, 236 (39.3%), to affirm that none of their parents had any of the diseases. On the other hand, almost the same, i.e., 234 (39%), said that both of their parents have one cardiovascular health-related disease or another.
| S/no. | Pre-cardiovascular indicators | - | Pre | Post | ||
| Freq. | % | Freq. | % | |||
| a. | Do you have diabetes? | Yes | 104 | 17.3 | 104 | 17.3 |
| No | 470 | 78.3 | 470 | 78.3 | ||
| Not sure | 26 | 4.3 | 26 | 4.3 | ||
| b. | Do you have high blood pressure? | Yes | 60 | 10.0 | 60 | 10.0 |
| No | 504 | 84.0 | 504 | 84.0 | ||
| Not sure | 36 | 6.0 | 36 | 6.0 | ||
| c. | Do your parents have heart-related problems? | Yes, one of them | 59 | 10.0% | 58 | 9.7 |
| Yes, both of them | 234 | 39.0% | 234 | 39.0 | ||
| No | 236 | 39.3% | 236 | 39.3 | ||
| Not sure | 70 | 11.7% | 72 | 12.0 | ||
| Report | |||||||||
| Time spent on vigorous exercise, | |||||||||
| carrying out exercise if there is social support | Mean | N | Std. deviation | Variance | |||||
| 10-30 (Cannot do at all) | 3.28 | 189 | 1.765 | 3.115 | |||||
| 40-60 (Moderately can) | 1.96 | 237 | .877 | .769 | |||||
| 70-100 (Can do highly) | 2.30 | 174 | 1.044 | 1.089 | |||||
| Total | 2.47 | 600 | 1.383 | 1.912 | |||||
| ANOVA Table | |||||||||
| Sum of squares | df | Mean square | F | P-value/Sig. | |||||
| Counter conditioning, time spent on vigorous exercise * exercise that increases breathing | Between groups | (Combined) | 189.787 | 2 | 94.894 | 59.276 | .000 | ||
| Linearity | 91.270 | 1 | 91.270 | 57.012 | .000 | ||||
| Deviation from Linearity | 98.518 | 1 | 98.518 | 61.539 | .000 | ||||
| Within groups | 955.731 | 597 | 1.601 | ||||||
| Total | 1145.518 | 599 | |||||||
| Measures of Association | |||||||||
| R | R-squared | Eta | Eta squared | ||||||
| Time spent on vigorous exercise * exercise if there is a friend (social support) to support me | -.282 | .080 | .407 | .166 | |||||
Table 7 shows the changes in outcome variables across time for each of the two independent variables, which are the correlates of socio-demographic factors and physical exercise training with respect to cardiovascular performance and health status among 600 volunteered freshmen of Babcock University. There were significant interaction effects observed between the two variables, which are the correlated socio-demographic factors and physical exercise training, perceived benefits, self-efficacy, interpersonal norms, social support, counter conditioning, stimulus control, overall time spent being active per week and on PA (mean minutes per day), indicating that the groups differed across time. Main effects tests for the group at post-intervention, with the baseline values as a covariate, revealed significant differences for counter conditioning, F = 59.276, with the mean score within group 1.60, df 2, p = .000, R = -282, and the overall minutes of those who said that they can do PA per week =2.30
5. DISCUSSION
The comparison of the baseline and the post-test showed an increase in the number of times of involvement in PE as respondents participated one to two times per week, ranging in number from 105 (17%) to 174 (29%). Females dropped out of organized physical activity/sport [9, 21]. Almost 50%, 321(53.5%), of females dropped more than males; the reason provided by them was that they had too much coursework. This finding was found to be the same as that reported earlier [4]. The effect of the combined social demographic characteristics and physical exercise showed a weak positive correlation between the gender and the BMI of the patients as the r-value was 0.273 and p=0.027 at 0.05 level (2-tailed). This was corroborated in a previous research [14] that demonstrated a positive relationship between participation in physical exercises by in-school adolescents [33] and their overall health and educational development [34]. There were significant interaction effects found between groups and time for perceived benefits, interpersonal norms, social demographic interaction, counter heart conditioning, stimulus control, overall time spent being active per week and on PA (mean minutes per day), indicating that the groups differed across time. This was in line with two different school-based studies [16] that reported improvements in physical activity rates in children and adolescents exposed to the intervention that involved spending more time on moderate to vigorous physical activity with results across studies ranging from 5 to 45 minutes; the participants had improved VO2max (volume of oxygen maximum intake) and exhibited increased daily physical activity and improved metabolic health. These findings also show that the tests of the main effects for the group at post-intervention, with the baseline values were taken as covariates, revealed significant differences for counter conditioning, with F = 59.276, mean score within group as 1.60, df 2, p = .000, R = -282, and the overall minutes of those who can do PA per week =2.30 [28, 29].
There was a positive relationship obtained between knowledge and participation in physical exercises by the respondents and their overall health and educational development; the same findings have been reported by many researchers [12, 30, 31, 33], who have reported a similar trend of increment in the relationship between the increase in knowledge and physical activity because of intervention involving physical activity courses taken by the college students.
CONCLUSION
The primary “take-away” lessons of this case report were that the participants were aware of the relationship between physical activities and their health. The knowledge mean score at the baseline was 19.57+ 6.12, and the knowledge mean score was 21.78± 5.36 on a 27-point scale (Table 1c), which increased greatly post-report. The result showed significant covariate differences for counter conditioning, with F = 59.276. The mean score within groups was reported at 1.60, df 2, p = .000, R = -282, and the cue to action showed an increase in the overall minutes of those who said they could do PA per week. Based on the outcome of this study, school administrators and policymakers should note the enormous contributions of PE interventions that they play a very significant role in determining the student's involvement in physical activities and also generate information that can be used to design an appropriate policy framework for implementing effective physical exercise in tertiary institutions and stimulating policy formulation or facilitating necessary curricular review, aimed at promoting young persons’ participation in physical activities for the purpose of maintaining good health status. It is thus concluded that socio-demographic factors and physical activity training have a significant effect on cardiovascular diseases and signs that predate cardiovascular diseases. Therefore, the students’ involvement, especially the undergraduate students of Babcock University, in physical activities through absolute incorporation of them into the curriculum of higher learning is an essential part, which can help maintain their adequate health status [13].
It is necessary to consider the scientific reason for this study and the strengths associated with this case report. It has been recommended that an appropriate exercise program, if added to the diet or drug therapy [20] along with the intervention of physical activities and exercise program, will help improve blood glucose control [35, 36] and reduce certain cardiovascular risk factors among persons with diabetes [2, 11]. The undergraduates may not have known that they are at risk of such diseases as diabetes, high blood pressure, arteriosclerosis, arthritic situations, and burden of cardiovascular diseases, or invariably at a high risk of total breakdown from these debilitating diseases or associated diseases if proper care is not taken [11]. However, this study has associated limitations that include a lack of funds, duration being limited to six weeks, which may have led to a lack of accommodation of the proper monitoring of the subjects, thereby reducing the dropouts, as well as performing only immediate post-intervention.
RECOMMENDATIONS
Based on the outcomes of the study, sedentary or lack of physical inactivity is a major risk factor for CVD and that moderate levels of regular physical activity confer significant health benefits; thus, the study provides the following recommendations:
All collegiate students should engage in regular physical activity at a level appropriate to their capacities, needs, and interests. Secondly, the university administrators should encourage physical activities by entrenching the physical education classes into the curriculum to motivate the young ones to adopt a preventive lifestyle that will reduce the illness burden in the university where heavy insurance is needed for the medical upkeep of the students in their colleges, institutions, and university. Thirdly, apart from the Health Principle course, there should be the introduction of zero unit seminars that may convert to compulsory participation in physical exercise of all students at all levels and which should reflect in the transcript of the students; finally, it is recommended that curriculum reviewer committees should include a professional and, in particular, a physical activity or exercise instructor to teach or train students in physical education courses.
LIST OF ABBREVIATIONS
| PA/PE | = Physical Activities/Physical exercises |
| MAP | = Mean Arterial Blood Pressure |
ETHICS APPROVAL AND CONSENT TO PARTICIPATE
Ethical approval for the study was obtained from Babcock University Research Ethics Committee with the researcher’s ethical referrer number BUHREC007/14.
HUMAN AND ANIMAL RIGHTS
The procedures followed were in accordance with the standards of the Babcock University Research Ethics Committee. Ethical approval for the study was obtained from Babcock University Research Ethics Committee with an ethical referrer number BUHREC007/14. The willingness of the respondents who volunteered was of great advantage during the study, and they all gave their informed consent, since a study of this nature deals with human nature, frailties, flexibilities, dynamism, and changes. Hence, proper informed consent was sought from both BU and the participants.
CONSENT FOR PUBLICATION
The pre-exercise medical evaluations were conducted of those who volunteered for the pre-exercise testing. The survey and the intervention were conducted within six weeks among the freshmen of University Ilishan-Remo, Ogun State. Some did not participate because many dropped out toward the end of the study because of vacation and pre-clinical testing (this accounted for the low turnout on the post-clinical text). Hence, all rights and consent are reserved for this publication.
AVAILABILITY OF DATA AND MATERIALS
The data sets used and/or analysed during this study are available from the corresponding author upon request.
FUNDING
The authors received no research funding, which also affected the number of tested participants.
CONFLICT OF INTEREST
The author declares no conflict of interest, financial or otherwise.
ACKNOWLEDGMENTS
Declared none.
TYPOLOGY OF PATTERNS OF PA/PE.
| WEEK 1 | WEEK 2 | WEEK 3 | WEEK 4 | WEEK 5 | WEEK 6 |
| 5 minutes warm up | 5 minutes of walking flexed arm hang | 5 minutes warm up | 5 Minutes warm up | 5 minutes of walking flexed arm hang | 5 minutes warm up |
| 5 minutes running on the spot 10 min walking/arm brisk walking- walking flexed arm hang for the rest 5 minutes |
Walking/arm 10 minutes brisk walking- walking flexed arm hang for the rest 5 minutes 5minutes harvard step |
Jogging/dancing Trunk twist and knee hugs, calf stretches 5 minutes Skip for 10 minutes |
Staircase/step climbing/back walkover Climbing staircase of 10 flight in the morning and rub down “Shake it up” arm and leg for one minute Breathing exercise 3 times in and out |
Walking/arm 10 minutes brisk walking- walking flexed arm hang for the rest 5 minutes 5minutes harvard step |
Jogging/dancing Trunk twist and knee hugs, calf stretches 5 minutes Skip for 10 minutes |