All published articles of this journal are available on ScienceDirect.

The Association between External Training Load, Perceived Exertion and Total Quality Recovery in Sub-Elite Youth Football
Authors Info & Affiliations
Abstract
Background:
Moderate to very large correlation between internal training load, external training load, and recovery status have been reported in elite youth football. However, little is known about subelite youth football training environments.
Objective:
The purpose of this study was to assess the association between training load and recovery status in young subelite football players.
Methods:
Twenty under-15, twenty under-17, and twenty under-19 players were monitored over a 6-week period during the first month of the 2019-2020 competitive season. The global positioning system technology (GPS) was used to collect external training load variables. The internal training load variables were monitored using the rating of perceived exertion (RPE) scale and session RPE (sRPE). The recovery status was assessed by the total quality recovery (TQR). A total of 18 training sessions and 324 observation cases were collected.
Results:
Small to moderate correlation between internal and external load was observed (r = -0.316 to 0.136, p < 0.05). Correlations between recovery status and external load were moderate for U15 (r = -0.326 to -0.240, p < 0.05), U17 (r = -0.316 to 0.136, p < 0.05) and U19 (r = -0.301 to 0.282, p < 0.05). The association between perceived exertion and external training load is only significant for U19 subelite football players.
Conclusion:
Current research suggested that subelite youth football players were more likely to have lower capacity to judge training exertion. Additionally, recovery status was positively correlated with acceleration and deceleration movements. This study provides a new overview about training load and recovery in subelite youth training environment. Future researche should examine the between- and within-individual nonlinearity across training load and recovery variations.
1. INTRODUCTION
Youth football is organized by age grouping for training and competition [1-3]. Literature reports inter-and intra-individual variation in psychophysiological along the youth development [4]. Consequently, psychophysiological profiles may vary between and within age groups [5-8], leading to a functional adaptation under training stimulus depending on individual responses with an age-related effect [9-11]. Moreover, it was reported that is the main reason for monitoring training load, providing important information about individual responses [12]. It is possible to quantify the training load by external and internal loads [13-15]. The external load is defined by the physical work performed during training or competition, whereas the internal load expresses the psychophysiological responses that the body initiates to cope with the requirements elicited by the external load [14]. Global positioning systems (GPS) and micro-electromechanical systems (MEMS) have been used to monitor the external training load [16, 17]. In football, the external training load has been extensively evaluated by covering distance, speeds, acceleration (ACC), decelerations (DEC), and accelerometry variables [18, 19]. Also, the typical accumulated training load has already been evaluated in young elite and sub-elite football players [5-10]. In sub-elite youth training, an age-related influence on external and internal training load has been reported [7, 10]. Teixeira et al. [7] were founded the lowest intensity has been found in U15 players’ training sessions regarding high speed running (HSR), average sprint distance (AvS), number of sprints, ACC and DEC. U17 presented a higher total distance (TD), AvS, max speed, rHSR, high metabolic load distance (HMDL), average sprint and number of sprints. U19 showed a higher perceived exertion and recovery status [7, 10].
Several studies reported a moderate correlation between internal and external load in elite youth football [20, 21]. Understanding the associations between measures would appear important to define the most appropriate monitoring strategy. However, this relationship remains little studied in sub-elite football training contexts [19, 22]. Indeed, these instruments and technologies are not available in many contexts (social, demographic, and economic), and some teams do not own tracking systems and wearable technologies [22]. Thus, the rating of perceived exertion (RPE) is the most commonly used technique to measure the internal training load [23]. RPE and session RPE (sRPE) is a valid and reliable tool to assess training intensity in youth football [23-25]. According to Haddad et al. [23], RPE describes the mean intensity during that training session or competition. In the same vein, the sRPE method aggregates the intensity and the duration of the training session (or competition) to calculate the training load or match load [22, 23]. Additionally, large correlations were reported between perceived exertion and external load indicators in youth football training [20, 21, 26]. Marynowicz et al. [21] recently referred to daily sRPE as a useful, straightforward, and cost-effective training load measurement in youth football.
However, the literature did not report a single or gold standard metric to assess fatigue recovery status and predict physical performance [27]. Total quality recovery (TQR), based on athletes’ recovery perceptions, is a possible instrument to assess the recovery status across the training process [28]. The TQR score is frequently applied to examine perceived exertion, recovery state, and well-being in youth football players [29-31]. Nevertheless, there is a need for more investigation on the TQR, RPE, sRPE, and external load cumulative training load. Given the importance of fatigue recovery status management, it is paramount to understand the association between perceived exertion, fatigue and external load [27, 32].
To the best of the authors' knowledge, little is known about the association between internal and external loads in sub-elite youth football training environments [7]. Thus, it will be possible to better understand the need to monitor in-between training sessions’ recovery quality to predict players’ readiness and training intensity. Based on the above-mentioned information, the main purpose of this study was to examine the association between training load and recovery status in young football players. Specifically, the purpose of this study was to assess the association between perceived exertion (sRPE and RPE) and recovery status (TQR) and their correlation with external load indicators across age groups (i.e., U15, U17 and U19 players).
2. METHODS
2.1. Subjects
Sixty sub-elite youth football players were monitored during a 6-week period in a sub-elite Portuguese football academy, among which 20 were under-15 (U15), 20 were under-17 (U17), and 20 were under-19 (U19) (Table 1).
| Variable | U15 (n = 20) | U17 (n = 20) | U19 (n = 20) | Total (n = 60) |
| Age (years) | 13.28 ± 0.49 | 15.39 ± 0.51 | 17.29 ± 0.55 | 15.32 ± 2.01 |
| Heigh (m) | 1.69 ± 0.78 | 1.76 ± 0.48 | 1.76 ± 0.70 | 1.69 ± 0.04 |
| Weight (kg) | 55.67 ± 9.41 | 64.28 ± 6.61 | 68.90 ± 8.39 | 62.95 ± 6.72 |
| BMI (kg/m2) | 19.29 ± 1.99 | 20.68 ± 1.79 | 22.11 ± 1.50 | 20.69 ± 1.41 |
| Experience (years) | 4.8 ± 0.90 | 6.6 ± 1.65 | 8.8 ± 1.70 | 6.73 ± 2.00 |
All participants, parents or legal guardians were informed about the study's aims and risks. This study included players and parents or legal guardians that had signed the informed consent. The present research was conducted according to the ethical standards of the Declaration of Helsinki. The experimental design was approved and followed by the local Ethical Committee from the University of Trás-os-Montes e Alto Douro (3379-5002PA67807).
2.2. Design
The daily training load was continuously monitored in the three age groups during the first month of the 2019-2020 competitive season. Training data account for a total of 18 training sessions and 324 observations. The eligibility criteria for individual data sets are considered a competitive 1-game week schedule and complete full training sessions. The microcycle included 3 training sessions per week with different durations: U15 = 148.99 min; U17 = 132.46 min; U19 = 195.95 min. The match data were not included in the analysis. The training sessions had, on average, 18 players. All age groups were trained on an outdoor pitch with official dimensions (FIFA standard; 100 × 70 m). The training sessions were performed on synthetic turf pitches, from 10:00 a.m. to 08:00 p.m. and with similar environment conditions (14–20°C; relative humidity 52–66%).
2.3. Methodology
The outfield players were monitored by a portable GPS throughout the training session (STATSports Apex®, Newry, Northern Ireland). The GPS device provided raw position, velocity, and distance at 18 Hz sampling frequencies, including an accelerometer (100 Hz), a magnetometer (10 Hz), and a gyroscope (100 Hz). Each player kept this microtechnology inside a mini pocket of a custom-made vest supplied by the manufacturer, which was placed on the upper back between both scapulae. All devices were activated 30 min before the training data collection to allow for an acceptable clear reception of the satellite signal. Concerning the optimal signal for measuring human movement, the matched data considered eight available satellite signals as the minimum for the observations [16]. The validity and reliability of global navigation satellite systems (GNSS) as GPS tracking has been well established in the literature [16, 17]. The current variables and thresholds should consider a small error of around 1–2% reported in the 18 Hz STATSports Apex® units [33].
2.3.1. External Training Load.
The external training loads were obtained with time–motion data: TD covered (m), AvS (m·min-1), maximal running speed (MRS) (m·s−1), relative high-speed running (rHSR) distance (m), HMLD (m), sprinting (SPR) distance (m), dynamic stress load (DSL) (a.u.), number of ACC and DEC (n). The GPS software provided information only about the locomotor categories above 19.8 km·h−1: rHSR (19.8–25.1 km·h−1) and SPR (>25.1 km·h−1). The sprints were measured by the number and average sprint distance (m). The HMLD is a metabolic variable defined as the distance, expressed in meters, covered by a player when the metabolic power exceeds 25.5 W·kg−1. HMLD variables include all high-speed running accelerations and decelerations above 3 m·s−2 [19, 22]. Both acceleration variables (ACC/DEC) considered the movements made in the maximum intensity zone: ACC (> 3 m·s−2) and DEC (≤ 3 m·s−2). The DSL variables were evaluated by a 100 Hz tri-axial accelerometer embedded with GPS devices, using three orthogonal axes (X, Y, and Z planes) to measure a composite magnitude vector (expressed as G force) [19, 22].
The high-intensity activity thresholds were adapted from previous studies [34, 35]. The GPS variables were recorded for each player. Training data were excluded from the analysis for data collection errors, injury events, missing training, or early withdrawal. The exclusion criteria resulted in the elimination of 36 observation cases.
2.3.2. Internal Training Load
The RPE scale proposed by Foster et al. [36] modified Borg’s Category Ratio-10 (CR-10) to monitor the exercise. Daily total training load was calculated with the sum of the accumulated training load using a 15-point Portuguese Borg Rating of Perceived Exertion 6-20 Scale (Borg RPE 6–20) [37]. The sRPE was obtained by multiplying the total duration of training sessions for each individual RPE score (sRPE = RPE × session duration) following a scale from 6 to 20 (arbitrary unit, a.u.) [23]. In football training, validity has been well established previously by assessing the correlations between changes in RPE and heart rate measures [19, 22]. RPE rating was collected individually at approximately 30 min after each training session using a Microsoft Excel® spreadsheet. Players were already familiarized with the procedures to report RPE in the weeks before data collection.
2.3.3. Recovery Status
Each player was asked to report the TQR score on a scale from 6 to 20 (arbitrary unit, a.u.) to monitor recovery. This scale was proposed by Kenttä & Hassmén [28] to measure athletes’ recovery perceptions. Previous research included the TQR score examining perceived stress and fatigue in youth football [29-31]. TQR scale application was preceded by familiarization some weeks before data collection. The TQR was applied individually approximately 30 min before each training session using a Microsoft Excel® spreadsheet.
2.4. Statistical Analysis
Descriptive statistics, Kolmogorov-Smirnov and Levene’s tests were used to assess normality and homogeneity. Associations between RPE, sRPE, TQR and external load indicators were calculated using Pearson’s parametric correlation associated with 95% confidence intervals (95% CI). The correlation magnitude was classified as: trivial if r ≤ 0.1, small if r = 0.1–0.3, moderate if r = 0.3–0.5, large if r = 0.5–0.7, and very large if r = 0.7–0.9 and almost perfect if r ≥ 0.9 [38, 39]. The intraclass correlation coefficient (ICC) was used to assess similarities between values for each age group; values less than 0.5, between 0.5 and 0.75, between 0.75 and 0.9, and greater than 0.90 are indicative of poor, moderate, good, and excellent reliability, respectively [40]. Data visualization for correlation matrix coefficients was performed using an open-source patch routine (RStudio software version 3.6.1). Positive and negative correlations are displayed on a blue and red scale. Statistical significance was set at p < 0.05. Data are presented as mean ± one standard deviation (SD). All statistical analyses were conducted using SPSS for Windows Version 22.0 (SPSS Inc., Chicago, IL, USA).
3. RESULTS
Table 2 presents the descriptive statistics (mean ± one standard deviation) and 95% CI for external load, internal load, and recovery status.
| Variables | U15 (n=102) | U17 (n=99) | U19 (n=120) |
| External load | |||
| TD (m) | 5316.18 ± 1354.45 | 6021.45 ± 1675.64 | 4750.43 ± 1593.46 |
| AvS (m·min-1) | 49.96 ± 16.35 | 56.84 ± 34.51 | 45.83 ± 15.60 |
| MRS (m·s-1) | 6.58 ± 0.82 | 7.94 ± 3.12 | 7.43 ± 1.15 |
| rHSR (m) | 53.23 ± 58 .34 | 166.06 ± 458.95 | 72.41± 65.95 |
| HMLD (m) | 489.11 ± 228.44 | 730.56 ± 483.38 | 524.90 ± 291.37 |
| SPR (m) | 28.13 ± 41.66 | 130.42 ± 462.56 | 40.16 ± 50.43 |
| SPR_N (n) | 1.85 ± 2.46 | 4.83 ± 4.81 | 3.12 ± 2.92 |
| DSL (a.u.) | 247.21 ± 135.86 | 261.28 ± 121.73 | 245.19 ± 144.87 |
| ACC (n) | 33.62 ± 18.80 | 53.76 ± 20.62 | 49.90 ± 20.19 |
| DEC (n) | 30.27 ± 19.77 | 49.77 ± 25.08 | 44.01 ± 22.53 |
| Internal Load | |||
| RPE (a.u.) | 13.73 ± 1.91 | 13.51 ± 1.76 | 12.45 ± 2.50 |
| sRPE (a.u.) | 2056.51 ± 171.87 | 1835.40 ± 158.71 | 2497.99 ± 224.69 |
| Recovery Status | |||
| TQR (a.u.) | 16.38 ± 1.92 | 16.24 ± 1.81 | 15.21 ± 2.16 |
The association between external load, internal load (i.e., sRPE), and recovery status (i.e., TQR) variables are presented in Table 3 for the different age groups (Table 2). Small to moderate correlations were observed between internal load (i.e., sRPE) and external load. The U15 and U17 age groups presented small correlations for TD and AvS. The U19 age group showed moderate correlations for ACC and DEC. Correlations between recovery status (i.e., TQR) and external load were moderate for the U15 and U19 age groups. U15 age group presented significant moderate correlations for TD (r = - 0.217, p = 0.029), AvS (r = - 0.238, p = 0.016), ACC (r = - 0.334, p < 0.001), and DEC (r = - 0.326, p < 0.001). The U17 presented trivial to small correlations for TD (r = - 0.183, p = 0.027), and AvS (r = 0.136, p = 0.018), ACC (r = - 0.316, p < 0.001) and DEC (r = - 0.313, p < 0.001). U19 age group revealed moderate correlations for MRS (r = 0.282, p = 0.002), ACC (r = - 0.316, p < 0.001) and DEC (r = - 0.313, p < 0.001).
| Pearson Parametric Correlation | |||||||||
| U15 | U17 | U19 | |||||||
| sRPE vs External Load | Value | 95% CI | p | Value | 95% CI | p | Value | 95% CI | p |
| TD (m) | -0,22 | (-0.21; -0.23) | 0.029 | -0.18 | (-0.17; -0.19) | 0.027 | 0.16 | (0.15; 0.16) | 0.087 |
| AvS (m·min−1) | 0.24 | (0.25; 0.23) | 0.016 | 0.14 | (0.03; 0.04) | 0.018 | 0.17 | (0.16; 0.18) | 0.061 |
| MRS (m·s-1) | 0.59 | (0.58; 0.62) | 0.559 | 0.03 | (0.03; 0.04) | 0.793 | 0.12 | (0.11; 0.12) | 0.193 |
| rHSR (m) | 0.63 | (0.62; 0.66) | 0.527 | -0.07 | (-0.07; -0.08) | 0.469 | -0.06 | (-0.05;-0.06) | 0.502 |
| HMLD (m) | 0.83 | (0.79; 0.82) | 0.409 | -0.14 | (-0.13; -0.14) | 0.182 | 0.14 | (0.13;0.14) | 0.133 |
| SPR (m) | 0.23 | (0.22; 0:24) | 0.816 | 0.03 | (0.02; 0.03) | 0.807 | -0.08 | (-0.07;-0.08) | 0.409 |
| SPR_N | 0.40 | (0.39; 0.42) | 0.691 | -0.09 | (-0.09;-0.10) | 0.371 | 0.02 | (0.01; 0.02) | 0.865 |
| DSL (a.u.) | -0.42 | (-0.39; -0.44) | 0.675 | -0.09 | (-0.08;-0.09) | 0.385 | 0.13 | (0.12;0.14) | 0.154 |
| ACC (n) | 0.12 | (0.12; 0.13) | 0.204 | 0.09 | (0.09;0.10) | 0.346 | 0.32 | (0.30; 0.33) | <0.001 |
| DEC (n) | 0.58 | (0.55; 0.61) | 0.560 | -0.05 | (-0.04; -0:05) | 0.635 | 0.32 | (0.30; 0.33) | <0.001 |
| TQR vs External Load | Value | 95% CI | p | Value | 95% CI | p | Value | 95% CI | p |
| TD (m) | -0.14 | (-0.14; -0.15) | 0.147 | -0.03 | (-0.03; -0.04) | 0.742 | 0.16 | (0.01; 0.02) | 0.070 |
| AvS (m·min−-11) | 0.24 | (0.23; 0.25) | 0.015 | -0.08 | (-0.09; -0.08) | 0.412 | 0.13 | (0.12; 0.13) | 0.164 |
| MRS (m·s-1) | 0.06 | (0.06; 0.06) | 0.548 | -0.10 | (-0.09; -0.10) | 0.331 | 0.28 | (0.27; 0.29) | 0.002 |
| rHSR (m) | 0.34 | (0.32; 0.36) | 0.733 | -0.07 | (-0.07; -0.08) | 0.472 | 0.12 | (0.11; 0.13) | 0.188 |
| HMLD (m) | 0.11 | (0.11; 0.12) | 0.266 | -0.05 | (-0.04; -0.05) | 0.643 | 0.12 | (0.11; 0.12) | 0.200 |
| SPR (m) | 0.02 | (0.02; 0.02) | 0.854 | -0.07 | (-0.07; -0.08) | 0.479 | 0.08 | (0.08; 0.09) | 0.356 |
| SPR_N | -0.26 | (-0.25; -0.27) | 0.797 | -0.10 | (-0.09; -0.10) | 0.339 | 0.15 | (0.14; 0.15) | 0.104 |
| DSL (a.u.) | -0.07 | (-0.06; -0.07) | 0.511 | -0.09 | (-0.08; -0.09) | 0.389 | 0.18 | (0.17; 0.19) | 0.047 |
| ACC (n) | -0.33 | (-0.32; -0.35) | <0.001 | 0.06 | (0.05; 0.06) | 0.586 | 0.30 | (0.29; 0.32) | <0.001 |
| DEC (n) | -0.33 | (-0.31; -0.34) | <0.001 | -0.07 | (-0.07; -0.07) | 0.502 | 0.24 | (0.22; 0.25) | 0.009 |
| TQR vs sRPE | Value | 95% CI | p | Value | 95% CI | p | Value | 95% CI | p |
| RPE (a.u.) | 0.12 | (0.12; 0.13) | 0.216 | 0.03 | (0.03;0.03) | 0.757 | 0.16 | (0.16;0.17) | 0.071 |
| sRPE (a.u.) | 0.09 | (0.09; 0.09) | 0.352 | 0.10 | (0.09;0.10) | 0.312 | -0.01 | (-0.01;-0.01) | 0.902 |
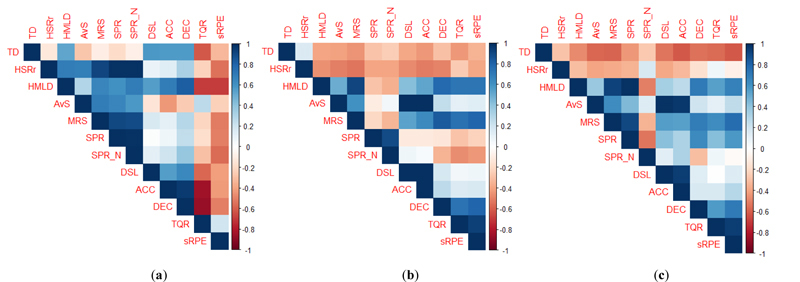
Fig. (1) presents the correlation matrix of each age group for external load, internal load (i.e., sRPE), and recovery status (i.e., TQR). All age-group presented low values for ICC (ICCU15 = 0.013, p = 0.387; ICCU17 = 0.036, p = 0.269; ICCU19 = 0.029, p = 0.350).
4. DISCUSSION
The main purpose of this study was to assess the association between perceived exertion (sRPE and RPE) and recovery status (TQR) and their correlation with external load indicators across age groups (i.e., U15, U17 and U19 players). Current findings reported small to moderate positive correlations between sRPE and external load. At the same time, a negative correlation between TQR and external training load was found only in the U15 age group for ACC and DEC. Nevertheless, a positive moderate correlation was observed in the U19 group for ACC, DEC, and MRS. sRPE and TQR showed no statistically significant correlation for all age groups.
A small correlation between TD and AvS was observed in U15 players. The U17 presented trivial to small correlations for TD, AvS, ACC and DEC. The U19 had a moderate correlation with ACC and DEC. These findings are in line with Marynowicz et al. [21] results that reported large, positive correlations between RPE with TD, player load and ACC (r = 0.70 and 0.62, respectively, p < 0.001). By contrast, the authors reported also large, positive correlations for players’ load, RPE and high intensity measures (r = 0.16 to 0.64, p < 0.001). Another finding observed by Marynowicz’s study was small to moderate correlations between (r = 0.16 to 0.39, p < 0.001). Casamichana et al. [34] reported associations for player load with sRPE (r = 0.70, p < 0.05). TD was associated with player load and sRPE (r = 0.70 and r = 0.74, all p < 0.05, respectively). Gaudino et al. [41] reported moderate correlation of RPE with HSR, body impact and acceleration (r = 0.14, r = 0.09, and r = 0.25, all p < 0.001, respectively). Rago et al. [42] noted a moderate correlation between MSR and HSR (r = 0.53 to 0.59; p < 0.05). Additionally, the authors reported significant correlations for total distance, low-speed running, and PL with the HR-based methods and sRPE (r = 0.71– r = 0.84; p < 0.01). RPE correlated with HSR and SPR (r = 0.40, r = 0.67; p < 0.01, respectively).
The main novelty of this research was to assess the associations between external training load, perceived exertion and total quality recovery in sub-elite youth training environments. The perceived exertion varies according to age and competitive level [5-8], considering the availed research. Current research provides new evidence on the magnitude of the correlations between external, internal, and recovery status in sub-elite youth football players [7, 43]. Another reason may be that training sessions are more focused on tactical principles and collective behaviour in the upper stages [5, 8]. On the other hand, the training of younger players should be more focused on constrained tasks and technical skills [5, 44]. Thus, the time spent in -intensity zones and normalizing session duration may affect the perceived exertion [8]. Additionally, knowledge of exercise duration seems to influence the decision to reduce or increase self-paced pacing and exercise performance [25]. Consequently, a conscious RPE could lead to poor decisions due to the selection of appropriate self-pacing exercise intensity [45, 46]. It is reasonable to state that coaches’ staff are prone to design training programs with more volume and less intensity for younger players [47, 48]. Additionally, sub-elite youth football players seem to have a lower perceived exertion of the accumulated training load [7, 43].
Understanding training load and recovery associations could contribute to controlling fatigue effects and determining potential pacing strategies [45, 46]. However, the literature reported the RPE scale is a physiological and volatile construct depending on the individual cognitive focus [45, 49, 50]. For this reason, RPE can be dissociated from the brain and peripheral physiological systems through various psychological mechanisms [45-48]. Especially, perceived exertion in young football players may be influenced by expertise level, self-perception of competence, and practice experience [51, 52]. This happens because sub-elite youth football players are more likely to have a lower capacity to judge perceived effort, as far as younger players tend to neglect high perceived exertions [47, 51]. Another reason is the strong motivation to practice, which is characteristic of these ages [53].
Concerning the association between recovery status (i.e., TQR) and external load, the present results demonstrated moderate correlations for the U15 and U19 groups. U15 players presented significant correlations for AvS, ACC, and DEC. The U19 revealed significant correlations with MRS, ACC, and DEC. Current data suggested that the TQR score is more correlated with acceleration movements. Consequently, the recovery status may vary according to the acceleration profile resulting from the specificity of the training session and periodization schedule. Brink et al. [29] showed that RPE and TQR scores did not contribute to performance prediction. Indeed, the literature reported an association between accelerations, movements, metabolic demands, and energy expenditure [15, 54]. Follow-up research should also focus on the association between recovery status, high-intensity movements, and metabolic outputs [19, 22].
In the present study, all age groups presented low values for ICC. This might be due to the maturation status varying within the age group [55, 56]. As such, biological maturation and relative age seem to play an important role in players’ development [10, 57]. That may lead to an alternative hypothesis for the perceived exertion by maturation level and individualized approach as bio-banding strategies and well-being states [58-60]. Therefore, age-related influence can be considered an important factor that may cause between-and within-individual variability [7, 14]. Likewise, these individual variabilities must be considered to manage fatigue recovery status and design customized pacing strategies. Additionally, linear procedures may underestimate the nonlinearity inherent in the perceived exertion and recovery status [61] within individuals. Indeed, RPE findings are difficult to generalize due to the wide variation according to different training settings, intra-player variation and coaches’ strategies [62, 63].
Thus, future studies should include individualized thresholds for measuring training load [64, 65]. Applying nonlinear analysis approaches can amortize the inconsistency in perceived reporting [66, 67]. That may occur because of a higher sRPE and RPE, associated with a less recovery status between training sessions [7, 43]. One should also consider the positional role, training mode, player’s starting status, and contextual factors [22]. GPS reliability has been extensively scrutinized in the literature, and its accuracy has improved with increasing sampling frequency for satellite signal processing [16, 33]. Several papers reported that the total distance is the most reliable parameter; on the contrary, other ones, such as acceleration and deceleration, are crucially unreliable. In fact, according to Buchheit et al. [68] and Malone et al. [69], not all parameters downloaded using GPS devices can provide reliable results and strong funding, and in this case, this limitation could affect the solidness of results. Future researchers should develop composition equations using a reduction approach such as principal component analysis to extract meaning in emerging new source information [17].
The current study presents some limitations: (i) data refer to only 6 weeks of training, and the sample size is rather small to examine seasonal variation; (ii) data are only representative of local sub-elite football academy performance level, and caution should be exercised and extrapolated to other youth training environments or performance levels; (iii) the present study analyzed the overall training session disregarding the training mode for each training exercise and other factors, such as training day, playing position and periodization structure [22, 43]; (iv) maturation status [10, 60], well-being variables [58, 59] and metabolic outputs were not reported [34, 35]; (v) the relationship amongst training and match-play has also not been considered [70-72].
5. PRACTICAL APPLICATIONS
This study provides new insights on the association between training load and recovery status in young football training. Researchers, coaches, sports analysts, and practitioners should be aware of the age-related differences to apply perceived scales and analyze the interdependence between internal and external training loads. Younger football players seem to have a lower perceived exertion on the accumulated training load. Likewise, inter- and intra-individual variability must be considered to manage fatigue recovery status and design customized pacing strategies. Finally, an individualized approach may optimize high-intensity efforts, which were perceived differently according to the competitive level. Higher sRPE and RPE may be associated with a lower recovery status between training sessions. Nonetheless, concerning sub-elite younger players, the recovery status plays a minor role due to a low perceived exertion.
CONCLUSION
The present study analyzed the association between perceived exertion, recovery status and external training load in sub-elite youth football according to age group (i.e., U15, U17, and U19 players). Sub-elite youth football players were more likely to have a lower capacity to judge perceived exertion. Additionally, recovery status was positively correlated with acceleration and deceleration activities. Finally, this research provides a new overview of training load and recovery in sub-elite youth training environments.
LIST OF ABBREVIATIONS
| ACC | = Number of Accelerations |
| ACC/DEC | = Acceleration Variables |
| AvS | = Average Speed |
| CD | = Central Defenders |
| CM | = Central Midfielders |
| CR-10 | = Borg’s Category Ratio-10 |
| DEC | = Number of Decelerations |
| DSL | = Dynamic Stress Load |
| FB | = Fullbacks |
| FW | = Forwards |
| GK | = Goalkeepers |
| GNSS | = Global Navigation Satellite Systems |
| GPS | = Global Positioning System Technology |
| HMLD | = High Metabolic Load Distance |
| ICC | = Intra-class Correlation Coefficient |
| MD | = “Match Day minus format” |
| MEMS | = Micro-Electromechanical Systems |
| MRS | = Maximal Running Speed |
| rHSR | = relative High-speed Running Distance |
| RPE | = Rating of Perceived Exertion |
| SD | = Standard Deviation |
| SPR | = Sprinting Distance |
| sRPE | = Session Rating of Perceived Exertion |
| TD | = Total Distance Covered |
| TQR | = Total Quality Recovery |
| U15 | = Under-15 |
| U17 | = Under-17 |
| U19 | = Under-19 |
| WM | = Wide Midfielders |
ETHICS APPROVAL AND CONSENT TO PARTICIPATE
The experimental approach was approved and followed by the local Ethical Committee from the University of Trás-os-Montes & Alto Douro (3379-5002PA67807).
HUMAN AND ANIMAL RIGHTS
No Animals were used that are the basis of this study.
CONSENT FOR PUBLICATION
All participants, parents or legal guardians were informed about the study's aims and risks. The study includes only players and parents or legal guardians that have signed the informed consent.
AVAILABILITY OF DATA AND MATERIALS
Not applicable.
FUNDING
This project was supported by the National Funds through FCT - Portuguese Foundation for Science and Technology (UIDB/DTP/04045/2020).
CONFLICTS OF INTEREST
The authors declare no potential conflict of interest.
ACKNOWLEDGEMENTS
The authors acknowledge all coaches and playing staff for cooperating during all collection procedures.