All published articles of this journal are available on ScienceDirect.

Investigating the Influence of ACTN3 R577X Polymorphism on Performance and Angular Kinematics Using Motion Capture Technology
Authors Info & Affiliations
Abstract
Background:
The ACTN3 gene is known as the “sprinter gene” due to the increased frequency of the R allele of the gene in various cohorts of elite sprinters compared to the general population. In situ muscle fibers that express α-actinin-3 protein can produce more force than the muscle fibers that are α-actinin-3 deficient. In vivo analysis showed that individuals lacking the R variant of the gene (ACTN3 XX genotype) encoding α-actinin-3 demonstrated slower running times and lower peak knee torque at higher angular speeds (30–180 deg/s).
Aim:
The aim of this study is to investigate the influence of the ACTN3 gene on performance and angular kinematic characteristics by comparing ACTN3 RR+RX and ACTN3 XX individuals during explosive jumps and sprints using motion capture technology.
Methods:
The kinematic and force data were obtained using a Qualisys Track Manager (QTM) system, and DNA was isolated from white blood cells using standard procedures. The 291-bp PCR fragment was electrophoresed, visualized under UV light, and finally, digested with Hpy8 restriction endonuclease.
Results:
ACTN3 RR+RX individuals demonstrated statistically significant differences (P<0.05) in SJ, CMJ, and DJ jump height, greater mean values of peak vertical ground reaction force (PVGRF), increased angular velocity at the knee joint during the DJ jump, and greater torque production at higher angular speeds during 5-m sprints.
Conclusion:
In conclusion, our study allowed us to deepen our knowledge regarding the role of α-actinin-3 protein in human locomotion. The results indicate that the ACTN3 gene influences force production and certain angular kinematic characteristics during explosive jumps and sprints.
1. INTRODUCTION
Various phenotypes, such as body height, explosive strength, muscle power, tendon elasticity, blood dynamics, VO2max, and anger management, influence the athletic performance. Each of these is the result of interactions among many physiological, anatomical, biomechanical, and psychological factors [1]. These phenotypes are believed to be influenced by the inheritance of more than 20000 genes that define humans. ACTN3 is the most investigated gene in relation to athletic performance. Case-control studies have shown that ACTN3 RR homozygosity is more common in elite Australian [2], Finnish [3], Greek [4], Russian [5], Israeli [6], Polish [7], and Japanese [8] athletes, compared to the general population. Furthermore, α-actinin-3 deficient sprinters (ACTN3 XX genotype) have demonstrated less success in speed-related sports and slower sprint times in comparison to those who express α-actinin-3 in their muscles (ACTN3 RR or ACTN3 RX genotype) [9].
Furthermore, some association studies have reported an advantageous effect of α-actinin-3 protein on various power-related phenotypes, such as vertical jump height or short-distance sprint times [10-14], while others have not [10, 12, 15-17]. Some of the above studies were limited by their sample size and others by the use of field tests to evaluate the ability of the muscles to produce explosive speed and power; these tests provide less accurate results than laboratory analyses. Isokinetic dynamometry has also been used to investigate the influence of α-actinin-3 protein on single-joint angular kinematics at a constant angular velocity dictated by the machine [17, 18]. One of the limitations of isokinetic dynamometry tests is their weak correlation with multi-joint functional test results, such as vertical jumps or short sprints, involving a stretch-shortening cycle (SSC) type motion. Here, we sought to address these limitations and provide deeper insights into the influence of the ACTN3 R577X gene on human locomotion by using motion capture technology and by studying the influence of this genotype on more specific parameters that influence performance during rapid SSC types of movements.
Thus, the aim of this study was to investigate the influence of ACTN3 R577X gene polymorphism on acceleration, velocity, power output, peak vertical ground reaction force (PVGRF), and jump height, as well as angular velocity and torque on hip and knee joints during explosive jumps and sprints.
2. METHODS
All methods used in this study were approved by the Human Research Ethics Committee at Mahidol University (Ethics Application ID: MU-CIRB 2019/049.1102) and carried out in accordance with relevant guidelines and regulations. All participants received written and verbal descriptions of the experiment and provided written informed consent prior to testing.
Professional power-oriented athletes, females, sprinters or individuals who performed regular sprint-power related or heavy resistance exercises were excluded from our analysis. Only right-leg-dominant male Southeast Asians (for ≥3 generations), with a mean body mass index (BMI) of 23 kg/m2, were included in this study to ensure both body composition and genetic homogeneity. The first group comprised a total of twenty-six participants who produced α-actinin3 protein in their muscles (ACTN3 RR and ACTN3 RX genotypes), while the second group that served as the control group included seven participants with ACTN3 XX genotype who were completely α-actinin3 deficient. No significant differences in anthropometric characteristics, such as weight, height and the average BMI, were observed between the two groups, as shown in Table 1 (p <0.05).
Table 1.
| Gender | Males | |
|---|---|---|
| Genotype | RR+RX (n=26) | XX (n=7) |
| Age (years) | 25.9 ± 5.1 | 26.2 ± 3.5 |
| Weight (kg) | 71.5 ± 9.9 | 66.7 ± 9.9 |
| Height (cm) | 174.1 ± 5.7 | 168.5 ± 4.7 |
| BMI (kg/m2) | 23.5 ± 2.92 | 23.4± 2.8 |
Participants who answered ‘yes’ to any of the eight PAR-Q questions or suffered from medical conditions interfering with their ability to exercise, such as high blood pressure, acute or chronic musculoskeletal injuries, were excluded from the study. Furthermore, the GPPAQ questionnaire was used to assess the current physical activity levels of our cohorts. Participants who reported to be involved in sprint-strength related leisure time activities, such as tennis and gym workout, or participants whose work involved vigorous activity, including handling of very heavy objects (e.g., scaffolder, construction worker, refuse collector, etc.), were excluded from this analysis. Each individual had the right to withdraw from the project at any time without prior notice.
Participants were asked to refrain from caffeine and alcohol during and before all tests. To ensure adequate access to carbohydrate energy stores, participants were asked to consume an energy drink (1 to 1.5 g•kg−1 BM) before the commencement of the testing session, according to Australian Institute of Sport (AIS) guidelines (https://www.ausport.gov. au/ais/sports_nutrition), composed of mainly liquids and carbohydrates.
2.1. Study Overview
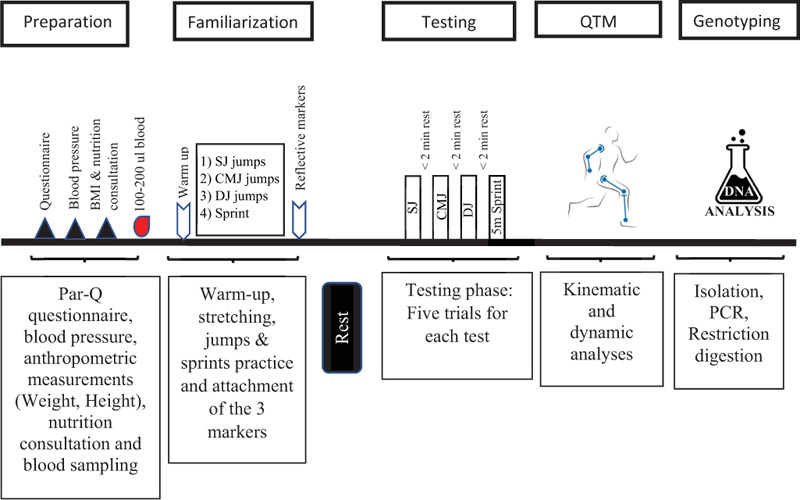
One week before the tests, all participants received comprehensive instructions regarding the tests. Two hours prior to the test, participants were asked to practice three types of jumps (SJ, CMJ & DJ) and one explosive sprint (Figs. 1 and 2) in order to familiarize themselves before they performed 5 trials for each test, as shown in the study timeline presented in Fig. (3). All the tests were performed during 2020 by the same research group using the exact same equipment.
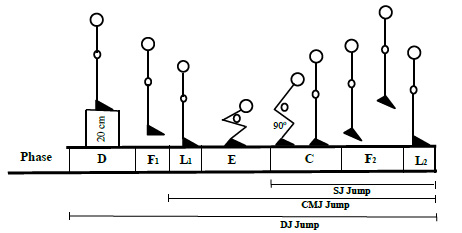
SJ jumps were executed starting from a parallel 90° feet alignment (Phase C), as shown in Fig. (1). The starting position of the knee angle was measured with a handheld goniometer, followed by a restricted arm motion jump (Phase F2) according to the procedure described earlier [19, 20]. For CMJ trails, the participants started from the upright standing position (Phase L1), performing a preliminary fast downward movement by flexing their knees and hips (Phase E), and then immediately extending their knees and hips again (Phase C) to jump vertically up off the ground (Phase F2). For DJ jump trails, the participants were made to stand on a 20 cm box (Phase D), and then they had to step off from the box (Phase F1) and immediately jump up vertically after touching the ground (Phases E, C and F2).
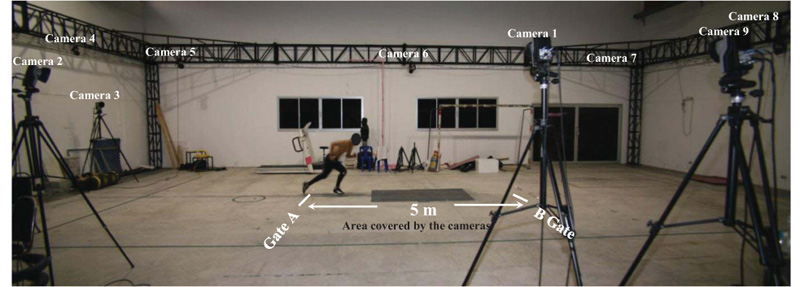
For the sprint test, the participants were asked to perform a 5-meter sprint between Gate A and Gate B while they were captured by the cameras, as shown in Fig. (2). All participants were encouraged to sprint as fast as possible.
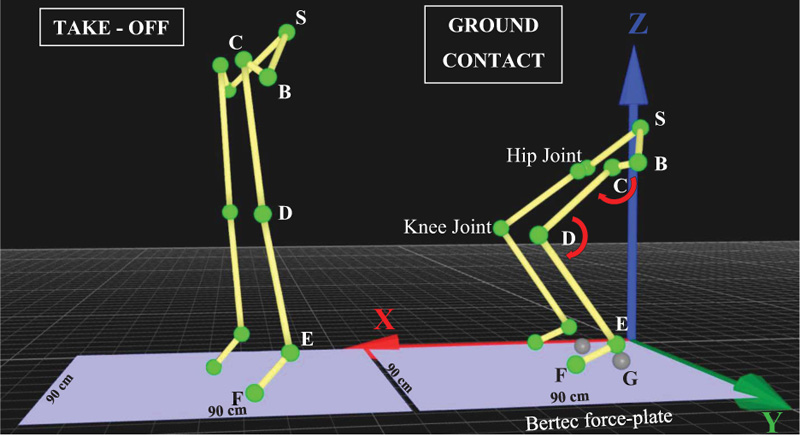
Motion capture technology was used for data collection, and data analysis was conducted by using the Qualisys Track Manager (QTM) software. Eleven reflective markers were set on specific anatomical positions of the trunk and lower limbs. More specifically, one marker was set on Sacrum (S), two reflective markers were set on the left and right anterior superior iliac spine (B), two markers were set on the left and right greater trochanter (C), two markers were set on the left and right lateral condyle (D), two markers were set on the left and right apex of the lateral malleolus (E), and two markers were set on the left and right 5th metatarsal (F), as indicated in Fig. (4). For detecting the reflective markers accurately, the exposure, threshold, frequency and flash time of each of the nine cameras were set accordingly.
When the markers’ reflection was not satisfactory, the reflective marker’s exposure, threshold or flash time were adjusted in order for the researcher to be able to view the reflection of the marker clearly on the screen. After that, before each testing session, the equipment was calibrated by the wand and L-shaped structure provided by the manufacturer.
The captured data from reflective markers (S) were used for analyzing kinematic data, such as peak velocity, acceleration, jump height, and running times. The captured data from reflective markers (B, C and D) were used for calculating angular velocity and acceleration in the hip joint, while the captured data from reflective markers (D, E and F) were used for the calculation of angular velocity and acceleration in the knee joint. For the calculation of torque in hip or knee joints, we used the formula mentioned below [21], and for segmental mass estimation, we followed the procedure described by Xu and Zhou [22].
Torque = Segmental mass in hip or knee joints x Angular acceleration
To measure force-related dynamic data, we used a Bertec force-plate (90cm x 90cm), as shown in Fig. (4). For the calculation of peak power and rate of force development, we used the formulas as follows [21].
Peak power = F (force production at peak velocity) x V (Peak velocity)
Rate of Force Development = Peak force / Time to peak force
2.2. Genetic Analysis
The researchers who performed the genetic analysis were blinded to the performance or kinematic findings, and thus, were considered to be at low risk of bias. Few drops of blood (100-200 μl) were obtained using a spring-loaded blood lancet to pierce the skin of the subject’s fingertip. The DNA was extracted from white blood cells using commercial DNA isolation kits. The procedure was carried out at room temperature, and the DNA (yield 10-20 μg) was stored at -20 ˚C.
Genotyping was performed by polymerase chain reaction (PCR) using a MiniAmp™ Thermal Cycler. To amplify the exon 16 that contains the ACTN3 polymorphism, we used Polymerase Chain Reaction (PCR) with the following primers: forward primer 5′-CTGTTGCCTGTGGTAAGTGGG-3′ and reverse primer 5′ TGGTCACAGTATGCAGGAGGG-3′ [4].
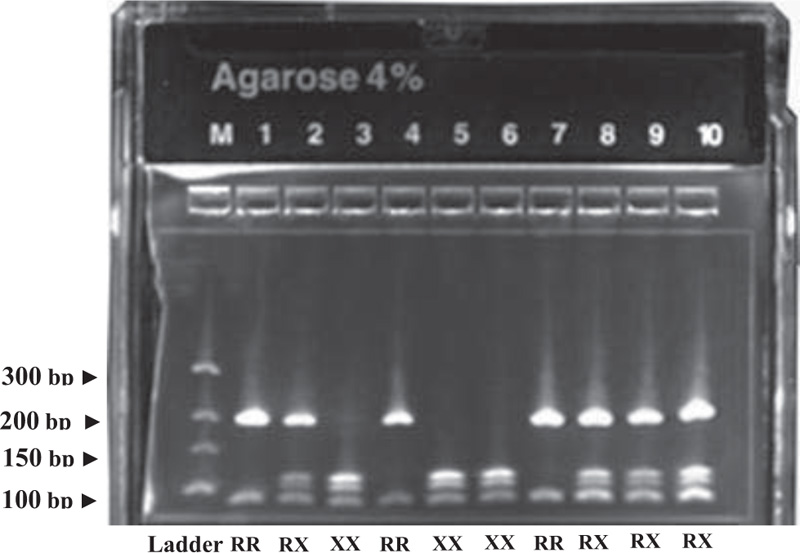
The PCR master mix contained 1 μl of DNA, 0.2 μl primers, and 0.15 μl Taq polymerase, and was performed for 30 cycles. To electrophorese the amplified 291 bp PCR product, we used 2.5% agarose gels. To identify the ACTN3 genotypes, the 291 bp amplified DNA fragment was further digested by Hpy8 Restriction endonuclease and then electrophoresed again in 4% agarose gel. Four fragments of 205 bp, 108 bp, 97 bp and 86 bp in length identified the ACTN3 RX genotype, two bands at 205 bp and 86 bp identified the ACTN3 RR, while three bands at 108 bp, 97 bp and 86 bp identified the ACTN3 XX genotype, as shown in Fig. (5).
3. STATISTICS
G*Power version 3.0.10 was used for the calculation of sample size. The calculation of sample size was based on the mean value and the standard deviation (mean ± SD) of the tested parameters derived from previous studies [17, 18]. The total sample size deemed necessary by using an alpha of 0.05 and at least an effect size of F-test of 0.80 to achieve statistical significance between the tested genotype groups was seven participants for each group. The observed genotype counts were not statistically different from those expected under Hardy–Weinberg equilibrium (HWE). To compare the mean values between the participants with ACTN3 RR+RX and ACTN3 XX genotypes, we used a T-test, and to check the normality, we used the Kolmogorov Simonov test. All statistical analyses were conducted with SPSS software (ver. 18). The significance for all tests was set at 5% (p-value < 0.05).
4. RESULTS
The influence of α-actinin-3 deficiency on jump height and PVGRF
ACTN3 RR+RX male participants demonstrated statistically significant (p= 0.005) better mean SJ jump height (43.3 cm ± 4.2 cm) compared to their ACTN3 XX counterparts (38.2 cm ± 1.5 cm). Furthermore, ACTN3 RR+RX male participants showed statistically significant better mean CMJ jump height (49.2 cm ± 4.7 cm, p= 0.026) and DJ jump height (46 cm ± 4.9 cm, p= 0.026) compared to their ACTN3 XX counterparts (41.2 cm ± 3.3 cm) and (44.4 cm ± 4.2 cm), respectively, as shown in Fig. (6) and Tables 2 and 3.
| - | RR+RX | XX | P-Value |
|---|---|---|---|
| Maximal velocity | 2.8 ± 0.2 m/s | 2.6 ± 0.1 m/s | 0.056 |
| Maximal acceleration | 31.8 ± 9.8 m/s2 | 28.6 ± 9.3 m/s2 | 0.449 |
| PVGRF at concentric phase | 901.4 ± 229.82 N | 846.1 ± 281.9 N | 0.603 |
| Jump height | 43.3 ± 4.2 cm | 38.2 ± 1.5 cm | *0.005 |
| Flight time/Take off time | 0.5 ± 0.03 s | 0.4 ± 0.03 s | 0.185 |
| Rate of force development | 2392.7 ± 612.1 N·s-1 | 1942.2 ± 506.9 N·s-1 | 0.09 |
| Peak power | 1163584 ± 835445 W | 896286.5 ± 685818 W | 0.45 |
| - | RR+RX | XX | P-Value |
|---|---|---|---|
| Maximal velocity | 3.0± 0.2 m/s | 2.8 ± 0.1 m/s | 0.064 |
| Maximal acceleration | 33.7 ± 5.8 m/s2 | 31.6 ± 3.6 m/s2 | 0.391 |
| PVGRF at concentric phase | 1086.1 ± 338.2 N | 1047.1 ± 316.6 N | 0.789 |
| PVGRF at eccentric phase | 373.3 ± 176.7 N | 255.3 ± 143.1 N | 0.121 |
| Jump height | 49.2 ± 4.7 cm | 44.4 ± 4.2 cm | *0.026 |
| Duration of contraction | 0.9 ± 0.1 s | 0.9 ± 0.2 s | 0.529 |
| Rate of force development at concentric phase | 3243.9 ± 1664.2 N·s-1 | 1967.1 ± 1007.1 N·s-1 | 0.067 |
| Peak power | 778748 ± 810369 W | 456274.6 ± 438633 W | 0.326 |
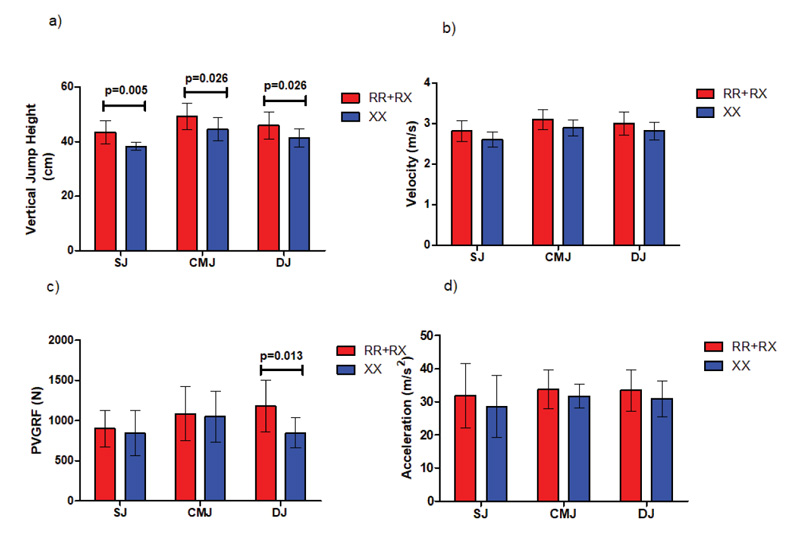
Moreover, in DJ jumps, ACTN3 RR+RX participants showed statistically significant (p= 0.005) higher levels of peak vertical ground reaction (PVGRF) (1182.1 ± 318 N) compared to their ACTN3 XX counterparts (846.3 ± 185.5 N, P=0.013), as shown in Fig. (6) and Table 4.
| - | RR+RX | XX | P Value |
|---|---|---|---|
| Maximal velocity | 3.0 ± 0.2 m/s | 2.8 ± 0.2 m/s | 0.122 |
| Maximal acceleration | 32.8 ± 6.2 m/s2 | 30.8 ± 5.5 m/s2 | 0.452 |
| PVGRF at eccentric phase | 1774.5 ± 810.1 N | 1308.4 ± 545 N | 0.168 |
| PVGRF at concentric phase | 1182.1 ± 318.0 N | 846.3 ± 185.5 N | *0.013 |
| Jump height | 46.0 ± 4.9cm | 41.2 ± 3.36 cm | *0.026 |
| Duration of contraction | 0.4 ± 0.1 s | 0.5 ± 0.1 s | 0.265 |
| Rate of force development | 7552.1 ± 11197 N·s-1 | 2937.1 ± 1878.5 N·s-1 | 0.292 |
| Peak power | 1147574 ± 1005020 W | 774736.4 ± 625497 W | 0.365 |
The influence of α-actinin-3 deficiency on peak velocity, acceleration and sprint running times
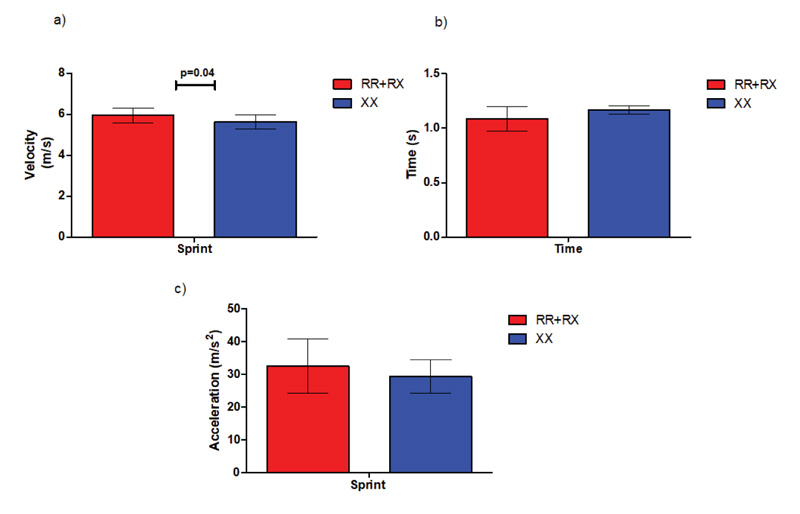
During the sprint test, ACTN3 RR+RX participants achieved statistically significant higher maximal velocity (5.9 m/s ± 0.3 m/s) compared to their ACTN3 XX counterparts (5.6 m/s ± 0.3 m/s, P=0.04), while no differences were detected in acceleration and best running times achieved during the test (Fig. 7).
The influence of α-actinin-3 deficiency on angular kinematics during explosive jumps
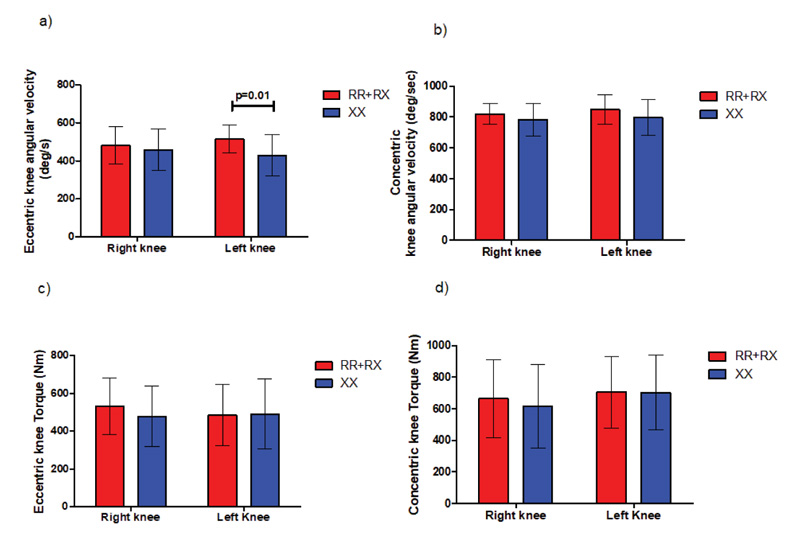
A statistically significant peak angular velocity (P=0.01) was found between ACTN3 RR+RX (552.2 ±72.2 deg/s) and ACTN3 XX (428.6 ±109.3 deg/s) genotype groups during the eccentric phase of DJ jump in the left knee joint without any differences in torque production, as indicated in Fig. (8). We detected no statistically significant differences in angular velocity and torque in either SJ or CMJ jumps.
The influence of α-actinin-3 deficiency on angular kinematics during explosive sprints
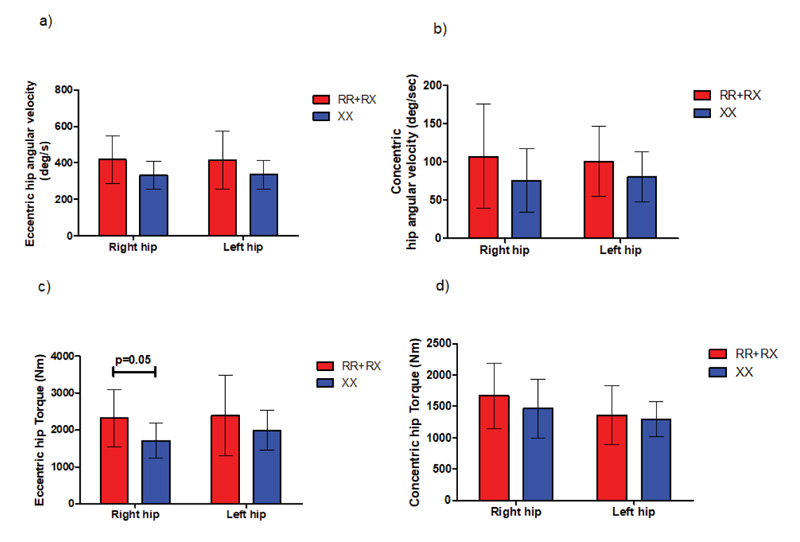
In 5m sprint test, our results showed a trend towards greater torque production at higher angular speeds for ACTN3 RR+RX (2323.7 ± 778.2 deg/s2) individuals compared to their ACTN3 XX (1708.5 ±476.2 deg/s2) counterparts, reaching statistical significance (p=0.05) in the right hip during extension phase, as shown in Fig. (9). We detected no statistically significant differences in angular velocity and torque in either SJ or CMJ jumps.
5. DISCUSSION
The aim of this study was to investigate the influence of the ACTN3 gene on certain performance parameters during explosive jumps and sprints through an extensive analysis comparing Southeast Asians of different ACTN3 genotypes. In jumps, the main finding was that the male ACTN3 RR homozygotes combined with RX heterozygotes demonstrated statistically significant differences (p<0.05) in jump height in SJ and CMJ jumps, in accordance with the results presented earlier [18]. Moreover, our participants performed DJ jumps, which are faster SSC jumps, and we found statistically significant differences (p<0.05) in jump height and peak vertical ground reaction (PVGRF) during the concentric phase of these jumps.
To perform a DJ jump, an individual stands on a box, steps off, hits the ground, and immediately jumps up as high as possible with a very short ground contact time and increased muscle contraction velocity along with rapid coupling between eccentric and concentric muscle action, commonly referred to as SSC. The increased power output obtained from the SSC phenomenon likely increases power output and performance in a DJ jump when compared with the pure concentric contractions of SJ jumps or longer ground-contact-time contractions, such as in CMJ jumps. Consequently, from our results, it can be suggested that the contraction-speed differences in SSC between jump types could explain why a statistically significantly different PVGRF between ACTN3 RR+RX and ACTN3 XX individuals was observed only in fast, eccentric, DJ-jump contractions.
Furthermore, findings from the angular kinematic analysis indicate that during a fast DJ-jump SSC cycle, only those individuals who have at least one ACTN3 R allele gene can produce peak torque at statistically significantly higher angular speeds (P=0.01) compared to their α-actinin-3 deficient counterparts. This observation is similar to the findings of recent studies using isokinetic dynamometry which show that ACTN3 RR individuals produce peak torque at higher angular speeds (30–180 deg/s) compared to their ACTN3 XX counterparts [14, 17, 18].
It has been reported that during DJ jumps, an initial rapid eccentric contraction of stretch-shortening cycle (SSC) activity typically accentuates subsequent concentric jump performance. DJ-jump eccentric loading can alter muscle stiffness and increase mechanical recoil properties of the muscles. First, α-actinin-3 protein is expressed only in the fast-twitch muscle fibers of those who carry at least one R allele of the ACTN3 gene [2]. Second, it is a non-contractile component of the Z-lines of the sarcomere, and its function is to anchor the actin/nebulin-containing thin filaments in a constitutive manner [23]. Third, it has been shown that during the eccentric phase of DJ jumps, the non-contractile muscle supports the contractile one to increase muscle force [24]. Taken together, we can hypothesize that α-actinin-3 protein may play a role in the ability of the type II sarcomeres to store elastic energy during the eccentric phase in DJ jumps of fast SSC, and this could be the reason for higher PVGRF and jump height during these types of high-velocity contractions without any detectable differences in kinematics between the two groups. This demonstrates that the observed increased force-producing capabilities of the participants encoding the a-actinin-3 were not sufficiently utilized during the jumps. This is most likely a result of an underdeveloped technique used by the participants to apply the increased force-producing capabilities of their muscles appropriately to the ground. It should be recognized that undertaking in-depth kinematic and kinetic analyses involving untrained individuals is more challenging than elite athletes, and the value of the current study lies in its comprehensive mechanical analysis undertaken by our group.
Moreover, in the sprint test, we observed a trend towards greater torque production at higher angular speeds for ACTN3 RR+RX individuals compared to their ACTN3 XX counterparts; this difference reached statistical significance (p=0.05) in the right hip during the extension phase. Interestingly, a recent study also demonstrated that certain kinematic variables of the hip and ankle but not the knee joint are significantly related to 10-meter sprint times [25]. Furthermore, a recent study that compared hip and knee angular kinematic characteristics showed significant torque and power output differences only in the hip joint, failing to detect any differences in the knee joint [26].
Some studies have associated higher knee contribution with greater vertical jump performance, while others have not [27]. Higher knee contribution during vertical jumps indicates the higher activity of the vastus lateralis and rectus femoris [28]. Interestingly, the rectus femoris contains a higher proportion of type II fibers than the hamstrings [29]. This muscle typology difference between certain muscle groups underlines a possible mechanism by which α-actinin-3 protein, expressed solely in type II fibers, could affect muscle power, which might be controlled by fiber-type proportions. This could explain the considerable subject variation in the hip and knee contributions during the preferred jump. An optimal jumping technique strategy (preferred hip:knee work ratio) is unique to an individual, and this variability is only partially explained by anatomical, anthropometrical, biomechanical, and physiological factors.
Furthermore, results from the sprint test showed significant differences in peak velocity (p=0.03) without any measurable running time differences. This supports the notion that testing only the best running times of athletes as a measure of excellence might lack the specificity needed to detect the more profound influence of the ACTN3 gene on human locomotion. This hypothesis points out the advantages of our approach over previous studies that investigated the influence of the ACTN3 genotype on performance based solely on field tests or the athletes’ best running times [9].
6. STRENGTHS AND LIMITATIONS
To the best of our knowledge, no other comprehensive study has been undertaken to determine the influence of genetics on human performance from this perspective. Apart from studies on α-actinin-3, our approach can be used in future works in sport science to investigate the influence of other genes or proteins on power-related phenotypes during rapid multi-joint movements.
In our analysis, we have recruited only Southeast Asian male volunteers. Despite our stringent approach screening each participant’s current power-related physical activity profile, differences in training history or other factors affecting performance besides genetics, such as jumping technique, lower limb body dimensions or composition that can influence jump or sprint performance, are difficult to be controlled. Replication of identified associations in larger populations is necessary to design personalized exercise interventions or suggest optimal jumping and sprinting strategies for achieving improved performance outcomes by including participants’ genetic backgrounds.
CONCLUSION
Our methodological approach using motion analysis technology allowed us to assess the influence of the ACTN3 gene on various dynamic and kinematic performance characteristics. This study provides evidence that the ACTN3 genotype influences the body’s ability to produce rapid and powerful contractions during SSC motion, and it indicates the need for larger studies to allow sophisticated statistical model analysis including all possible variables involved.
AUTHORS' CONTRIBUTION
IP supervised the study. THM and IP wrote the manuscript. THM, PW and IP extracted the DNA. IP conducted the PCR and genotyping. THM, PW and IP contributed to participants’ recruitment, data collection, kinematic and molecular analyses. VS assisted with participants’ recruitment. NC provided technical assistance for the use of cameras and the QTM software. All authors reviewed the final manuscript. All authors had an essentially intellectual contribution.
ETHICS APPROVAL AND CONSENT TO PARTICIPATE
All methods used in this study were approved by the Human Research Ethics Committee at Mahidol University, Thailand (Ethics Application ID: MU-CIRB 2019/049.1102).
HUMAN AND ANIMAL RIGHTS
No animals were used in this research. All human research procedures were followed in accordance with the ethical standards of the committee responsible for human experimentation (institutional and national), and with the Helsinki Declaration of 1975, as revised in 2013.
CONSENT FOR PUBLICATION
All participants received written and verbal descriptions of the experiment and provided written informed consent prior to testing.
STANDARDS OF REPORTING
STROBE guidelines and methodologies were followed in this study.
AVAILABILITY OF DATA AND MATERIALS
The data supporting the findings of the article are available in the “ACTN3 study data” at https://doi.org/10.5281/zenodo.5626501, with reference number: 10.5281/zenodo.5626501.
FUNDING
All chemical consumables for this study were covered by the corresponding author’s Early Career Research Grant A35/2562 Mahidol University, Thailand.
CONFLICT OF INTEREST
The authors declare no conflict of interest, financial or otherwise.
ACKNOWLEDGEMENTS
The authors would like to thank lab technician Jirayu Wongpanya for the technical assistance in setting up the cameras.