All published articles of this journal are available on ScienceDirect.
Acute Effects of Different Sprint Intervals on Blood Pressure, Heart Rate Variability, Lactate and Performance Responses in Physically Active Men
Abstract
Background:
Sprint interventions can be an excellent alternative for promoting positive adaptations to health and performance.
Objectives:
To verify the responses of different intervals between sprints in blood pressure, heart rate variability, lactate, and performance responses in physically active men.
Methods:
Ten male runners participated in the present study, trained in street running with at least one year of experience and a maximum of 3 years, with training frequency of at least two times and at the most four times weekly sessions, all participants without any kind of restrictions that could hinder the interventions—performing three sprint sessions (10 x 30m all out). Participants visited the laboratory on four occasions for ten consecutive days, with an interval of 48 hours between each visit. The first visit was intended to familiarize the participants with all experimental procedures. The remaining three visits were used to carry out the experimental protocols. At each visit, resting values of blood pressure (BP), heart rate variability (HRV), and lactate variables were collected. After rest collections, each participant completed the following experimental conditions: a) 10 sprint series (all-out) of 30 meters with 20 seconds of recovery (S 20), b) 10 sprint series (all-out) of 30 meters with 30 seconds of recovery (S 30) and c) 10 sprint series (all-out) of 30 meters with 40 seconds of recovery (S 40). After each protocol, the lactate values were collected 2 minutes and 30 seconds after the end of the sprints; BP was collected 60 minutes after the intervention (Post-10, Post-20, Post-30, Post-40, and Post- 50). After the blood pressure (BP) data was determined, the mean arterial pressure (MBP) was calculated using the formula MBP = SBP + (DBP X 2) / 3. The HRV was collected between 50 and 60 minutes after the end of the sprint session.
Results:
The study observed significant differences in the lactate variable for the comparison in the post and pre moments for all experimental conditions (S 20, S 30, and S 40) (p<0.001). Besides, significant differences were observed in effort perception for S 20 and S 30 from the sixth sprint (p<0.05). At S 40, significant discrepancies in effort perception started from the fifth sprint (p <0.05). No other significant differences were observed for BP (systolic, diastolic and mean) for all post-pre periods. Still in BP, in a post (intra) analysis, the conditions S 20 and S 40 demonstrated greater capacity for recovery of BP, suggesting a possible greater parasympathetic capacity. For HRV and sprint performance, no difference was found (p <0.05).
Conclusion:
The present study demonstrated that different recovery intervals did not reflect significant differences in hemodynamic, autonomic, lactate responses, and active individuals' performance submitted to sprint sessions. This study applied a protocol (10 x 30 m all out) with different recovery times (20, 30, and 40 seconds), and which, given this experiment, can serve as a training strategy (for health or performance) at different levels of physical conditioning.
1. INTRODUCTION
The training interval (IT) is a method of great importance in prescription training [1, 2]. In IT, among the different methodological variations of the stimulation time, time, type of recovery, and intensity, the determined sprints have been widely used [3]. In IT, sprints have two types of characteristics, sprint interval training (SIT) and repeated sprint training (RST) [4]. The difference is that SIT is generally applied with stimuli of approximately 30 seconds with a passive recovery of 2 to 4 minutes. The RST consists of a short stimulus (~ 3 to 7s duration) with a passive recovery of up to 60 seconds [5]. The number of series and/or repetitions of SIT or RST depends on the intensity imposed on stimuli. That is usually presented in interventions of this type, at maximum or supramaximal levels of physiological capacities [6], or based on subjective perceptions [7], characterizing levels of all-out efforts [8].
Traditionally, sprint interventions are used in sports to improve performance conditions [9, 10] and also in health promotion [11], with young people [12], adults [13], and the elderly [14]. Sprints, among their variations, allow the accomplishment of critical physiological adaptations for conditional improvement, either for health or performance [15]; studies have shown that sprints can be useful in improving glycolytic metabolism [16] and oxidative [17], especially intramuscular efficiency. Another positive consequence of sprint intervention is that these types of stimuli can promote different muscle adaptations [18], increased density, and the promotion of mitochondrial biogenesis [19, 20].
In addition to physiological improvements in favor of physical performance, the application of sessions containing sprint series is also great for improving health. Therefore, one of the positive consequences of sprints on health is an aerobic capacity improvement [3], assessed through maximum oxygen consumption (VO 2max). Studies have recently observed relevant results on body composition and general fitness after sprint interventions [21]. Other studies have demonstrated the importance of sprint sessions in the autonomic balance [22]. However, studies using sprints (SIT or RST) in the investigation of health indicators are still few [23]. However, the SIT or RST are variations belonging to the IT that have currently been extensively investigated, especially those with high-intensity characteristics, called high-intensity interval training (HIIT), which are applied with more prolonged stimuli (~ 1 minute or more) and also with longer recovery times (~ 1 minute or more) with an active or passive format [5, 24]. Brief findings elucidate positive results of HIIT in improving cardiovascular [25], cardiorespiratory [26], and metabolic [27] function.
Currently, some positions assist in the prescription of training using IT in high intensity (HIIT, SIT, and RST) to obtain improved performance [8] and health for different populations [28, 29]. The sprint intervention is an excellent option for training variation, as it imposes high-intensity stimuli at low volume (total time), which further optimizes time with positive responses for performance and health [11]. However, there is still a knowledge gap about some prescription variables, one of which is recovery time. Interval studies are scarce; in fact, it is known that the shorter the recovery time, the faster the energy recovery to maintain performance [30]. However, the consequences of time intervals in the different organic functions still need to be clarified, mainly regarding ranges with small differences. Based on the above, the present study's objective was to verify the responses of different intervals between sprints in blood pressure (systolic, diastolic, and mean), heart rate variability, lactate, and performance responses of physically active men. Our hypotheses for results would be that the shorter the interval between sprints, the better the cardiovascular responses (blood pressure and heart rate variability), due to higher intensity, the more significant parasympathetic reactivation after effort. That the shorter the interval time, the greater the accumulation of lactate due to increased metabolic demand. Finally, the longer the interval, the better the performance between the sprints.
2. METHODS
2.1. Participants
Ten males participated in the study Table 1, trained in street running with at least one year of experience and a maximum of 3 years, with training frequency of at least two times and at the most four times weekly sessions. The exclusion criteria were: the use of drugs and/or ergogenic resources that could influence the expected results (blood pressure control, beta-blockers, among others related to cardiovascular control, performance stimulators, among others) and no history of musculoskeletal disorders that could compromise the interventions. All participants were experienced in running and had optimal levels of the required mechanics technique. Above all, everyone underwent a biomechanical evaluation to analyze the method to minimize bias in the intervention. The participant's anthropometric measurements (weight, height, and fat percentage) were measured using a bioimpedance (following all protocols before an evaluation) device (InBody®, model H20), and the same researcher performed this analysis. Then, the body mass index (BMI) was calculated using the formula: weight / height2. All participants also received a recommendation not to eat foods that could interfere with cardiovascular responses (excessive consumption of salt, caffeine, alcohol, high-calorie foods, among others). However, all food and hydration during the intervention period were oriented to all participants. In this way, it minimized possible (negative) influences on nutrition in the investigated variables' responses. After explaining the research risks and benefits, the subjects completed the Physical Activity Readiness Questionnaire (PAR-Q). They signed a free and informed consent form under Resolution 466 of 2012 of the National Health Council (BRAZIL), 2016, and Helsinki's resolution.
| Variables | Participants |
|---|---|
| - | M ± SD |
| Age (years) | 26 ± 3 .3 |
| Weight (kg) | 74 . 6 ± 1 1 .1 |
| Height (m) | 1.7 4 ± 0.0 3 |
| BMI (kg / m 2) | 2 4 . 4 ± 3. 3 |
| Fat (%) | 10.1 ± 2.5 |
2.2. Experimental Design
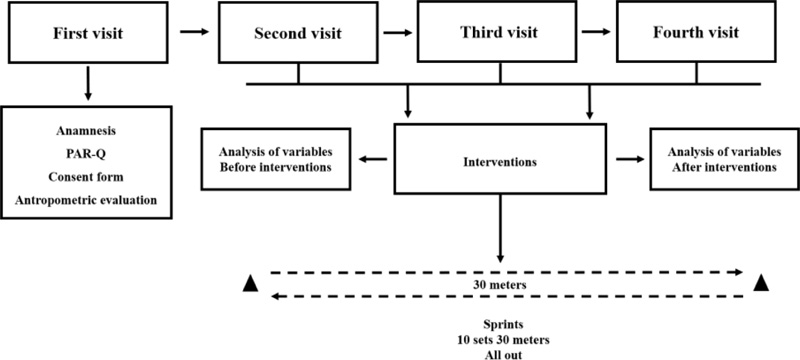
A blinded, randomized (Latin square method) and counterbalanced design was used (Fig. 1). Participants visited the laboratory on four occasions for ten consecutive days, with an interval of 48 hours between each visit. The first visit was to familiarize participants with all experimental procedures such as anthropometric measurement, reading, filling in the anamnesis, and the Physical Activity Readiness Questionnaire (PAR-Q) and Informed Consent. The remaining three visits were to carry out the experimental protocols. At each visit, resting values of blood pressure (BP), heart rate variability (HRV), and lactate variables were collected. The same researcher performed the analyses of BP, HRV, and lactate. A performance analysis was carried out by three researchers, being the same for all investigations. Thus, the level of confidence in the verification of the collected data was maintained. After rest collections, each participant completed the following experimental conditions: a) 10 sprint series (all-out) of 30 meters with 20 seconds of recovery (S 20), b) 10 sprint series (all-out) of 30 meters with 30 seconds of recovery (S 30) and c) 10 sprint series (all-out) of 30 meters with 40 seconds of recovery (S 40). After each protocol, the lactate values were collected 2 minutes, 30 seconds after the end of the sprints, BP was collected 60 minutes after an intervention (Post-10, Post-20, Post-30, Post-40, and Post- 50), and HRV was collected between 50 and 60 minutes after the end of sprint session. During the entire intervention period, participants were instructed not to perform any physical exercise, but only the present study's sprint sessions.
2.3. Training Protocols
Before performing the protocols, the participants completed a 20 minute warm-up on the exercise bike (Movement - model LXU G4) at an intensity between 40 and 60% of the reserve heart rate. This was followed by stretching of the entire lower body (thigh and calf) and paravertebral. The interventions consisted of ten sprint series (all-out) in 30 meters. Based on the previous literature [4], it is characterized by RST sessions. It determined three conditions: 10 sprint series (all-out) of 30 meters with 20 seconds of recovery (S 20), ten sprint series (all-out) of 30 meters with 30 seconds of recovery (S 30), and ten sprint series (all-out) of 30 meters with 40 seconds of recovery (S 40). The participants were familiarized with the type of intensity to be imposed on the sprints, being strictly oriented to apply as much speed as possible, thus characterizing all-out intensity [5]. For the realization of these conditions, a draw was carried out. The sprints were performed on a natural, flat surface, free of obstacles that could affect the participant's performance. A digital laser measuring device (40 meters capacity) was used for the determination of route distance, with an area calculation of the FortG Pro® brand, model FG026 ™, duly calibrated.
2.4. Analysis of Cardiovascular Variables
For the analysis of cardiovascular variables, BP and HRV values were adopted. At rest, both variables were collected over 10 minutes with individuals positioned in the sitting position [31]. After interventions, BP was analyzed immediately at the end of the sprints and 60 minutes in moments with an interval of 10 minutes (10, 20, 30, 40, 50, 60 minutes). Two measurements were made with a 1-minute interval, at the end of the 8th and 9th minutes for each 10-minute interval. After the two measurements, the average was calculated and thus the values of systolic (SBP) and diastolic (DBP) BP for each moment were determined. After the blood pressure (BP) data was selected, the mean arterial pressure (MBP) was calculated using the formula MBP = SBP + (DBP X 2) / 3. For BP analysis, a digital oscillometer device from the brand OMRON M6 (HEM-7001- E)® [32] was used.
After the sprints, HRV analysis was also performed for 10 minutes between the moments 50 and 60 minutes after the interventions. The objective of the analysis in this period was to reduce the bias of high sympathetic activation due to the high intensity performed in the sprints and, also to identify the capacity of parasympathetic reactivation 50 minutes after a sprint session (all-out) with different recovery intervals. HRV analysis was performed in a 5-minute interval (300 inter beats), considering the 10 minutes of analysis, the post-stabilization period (final 5 minutes) [33]. The mean of the time domain indices (RR, RMSSD, SDNN, and PNN50) and the frequency (LF, HF, and LF / HF) were calculated [34, 35].
In the time domain: normal RR (time between heartbeats and others) and, subsequently, based on statistical or geometric methods (mean, standard deviation, and indexes derived from the histogram or the Cartesian coordinate map of RR intervals), the indices translators of fluctuations in the duration of cardiac cycles were calculated, covering RMSSD (square root of the square mean of the differences between the adjacent normal RR intervals, in a time interval, expressed in ms), the SDNN (standard deviation of all RR normal) intervals recorded in a time interval, shown in ms) and the PNN50% (represents the percentage of adjacent RR intervals with a difference in duration more significant than 50ms). The RMSSD and the PNN50% represent parasympathetic activity. The SDNN represents sympathetic and parasympathetic activity but does not distinguish the changes in HRV due to an increase in sympathetic tone or withdrawal of vagal tone [36].
For HRV in the frequency domain, low-frequency components (Low Frequency - LF) were used, which correspond to the parasympathetic and sympathetic autonomic nervous system's joint action, with a predominance of the latter. High-frequency (High Frequency - HF) corresponds to respiratory modulation and represents the vagus nerve's activation. Finally, we used the LF / HF ratio, which, even with limitations on their use in autonomous balance [37], may indicate sympathetic-vagal balance [38]. The Polar RS800CX (model Multisport ™), Kempele, Finland® [39] was used to collect HRV. For the treatment of HRV, the data were transferred to the computer and attached to Polar Trainer 5 Software®. Correction procedures for all data were carried out on this platform and subsequently filed in TXT format to start treatment in Kubios HRV Standart Software, version 3.3.1. In this sense, all the data collected were calculated and presented in different patterns so that there were broad interpretations concerning HRV.
2.5. Lactate Analyzes
The lactate analysis was performed at baseline, 2 minutes, and 30 seconds after sprint interventions [40]. A portable device Accutrend ™ Plus brand model Roche ®, was used for capillary blood collection, with a lancet disposable specific to this analysis, Accu-Chek model -T- Safe™ brand Pro Uno Roche ® and disposable strips model Accusport BM Lactate ™ from Roche®. It was always carried out on the index finger (with no determination of laterality), and before the perforation, the individuals were sterilized, using gases and hospital alcohol (70%). The lactate analyses were realized by the same trained researcher, using disposable gloves and masks.
2.6. Performance Analyzes
Participants performed ten sprint series(all-out) of 30 meters with different recovery intervals (20, 30, and 40 seconds inter-series). To carry out the intervention, three researchers conducted the applicability of the activity. Since one researcher was responsible for the start of the sprints for the participant, for this action, a 5-second countdown and a start shout that was “go” (5,4,3,2,1, go) were signaled. This same researcher was responsible for monitoring inter-series recovery. The time of the participant's sprints was measured, and two researchers were necessary. These researchers were positioned one on each particular end of the route (30 meters), both with a chronometer preparing to release the count timer to launch the countdown to the sprint, that was triggered being strictly synchronized.
The same way activity was performed when the participant passed the 30-meter mark finishing the sprint. Both researchers blocked the timers simultaneously. Each researcher noted the time on a spreadsheet and then reset the device. Participants always used the same route, with all sprints performed in the round-trip direction. The timers were placed 15 meters after the mark for both ends of the sprint course, with this increment being used for post-sprint deceleration. For performance analysis, the average of each sprint obtained from the two timers used was used. Three devices with a stopwatch from Garmin®, model Forerunners 920 XT ™, were used for these measurements and controls. To adjust the intensity in each sprint, the effort perception scale (EP) was used, with a score from 0 (rest) to 10 (exhaustive) [41].
2.7. Statistical Analyses
The normality of all data was analyzed and confirmed by the Shapiro Wilk test. The ANOVA test (two-way) was conducted for repeated measures for the pre-post-intervention analyses within and between conditions for all variables. For multiple comparisons, Tuke's test was used when needed. For statistical analysis of potential, a significance level of 5% (p<0.05) was applied and to perform all analytical procedures the Graph Prism software, version 8.0.1 was used. To calculate the sample size, 3.1 G Power software was used, having an effect size of 0.75 and a power of 0.95.
3. RESULTS
Significant differences in lactate behavior (Fig. 2) were observed when comparing the post to pre moments with all experimental conditions (S 20, S 30, and S 40) (p<0.001). However, no significant inter-protocol differences were observed for the experimental conditions, being S 20vs. S 30 (p = 0.711), S 20vs. S 40 (p> 0.999), and S 30vs. S 40 (p = 0.621).
Blood pressure comparisons were performed based on pre-values to verify possible hypotensive effects. A comparison was also made for the post moments to analyze a possible parasympathetic capacity. No statistical difference was observed in the SBP for conditions S 20 (p = 0.742), S 30 (p = 0.994) and S 40 (p = 0.634) (Fig. 3A). Similar effects were observed in the DBP for conditions S 20 (p >0.999), S 30 (p = 0.996) and S 40 (p> 0.999) (Fig. 3B) and MBP for conditions S 20 (p=0.997), S 30 (p>0.999) and S 40 (p=0.963). In the post-intra conditions based on the post-immediate moment and significant differences (p <0.05) were observed for condition S 20 for all verification times (10, 20, 30, 40, 50, and 60 minutes). Differences were also observed (p <0.05) in the S 40 condition of 30 minutes to the end of the analysis (60 minutes). No difference was found for S 30 (p> 0.05). These findings suggest that S 20 and S 40 may promote greater capacity for parasympathetic reactivation after effort, with S 20 being superior in the potential hemodynamic regulatory action potential. For MBP, in the post comparison, only for S 40 a significant difference was observed, at moments 50 (p = 0.040) and 60 (p = 0.007) minutes.
With regard to HRV, no significant difference was observed in the time domain indexes (Fig. 4A) for the RR variables (p = 0.729, p = 0.996 and p = 0.551 for S 20, S 30 and S 40, respectively), SDNN (p = 0.408, p = 0.986 and p = 0.140 for S 20, S 30 and S 40, respectively), RMSSD (p = 0.235, p = 0.916 and p = 0.141, for S 20, S 30 and S 40, respectively) and PNN50% (p = 0.197, p = 0.909 and p = 0.276 for S 20, S 30 and S 40, respectively). Similarly, no significant differences were observed in the frequency domain indices for the LF variables (p = 0.473, p = 0.590, p = 0.921 for S 20, S 30 and S 40, respectively) (Fig. 5A), HF (p = 0.475, p = 0.603, and p = 0.923, S 20, S 30 and S 40, respectively) (Fig. 5B) and LF / HF (p = 0.455, p = 0.996 p = 0.994 for S 20, S 30 and S 40 respectively) (Fig. 5C).
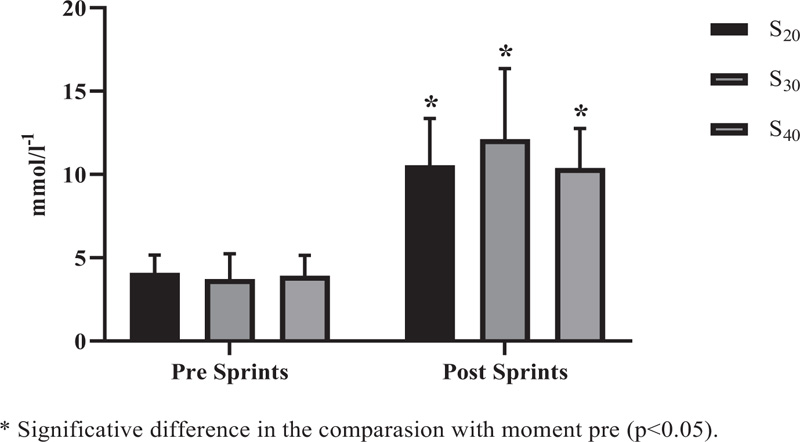
S 20 = 10 sprints series (all-out) of 30 meters with 20 seconds of recovery; S 30 = 10 sprints series (all-out) of 30 meters with 30 seconds of recovery S 40 = 10 sprints series (all-out) of 30 meters with 40 seconds of recovery.

S 20 = 10 sprints series (all-out) of 30 meters with 20 seconds of recovery; S 30 = 10 sprints series (all-out) of 30 meters with 30 seconds of recovery S 40 = 10 sprints series (all-out) of 30 meters with 40 seconds of recovery.
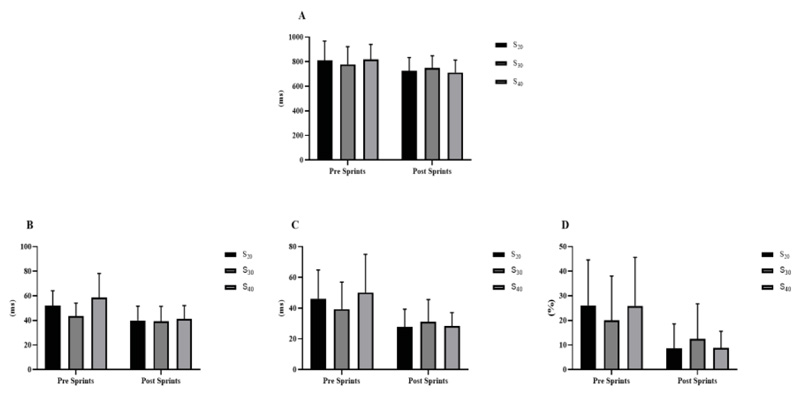
A = RR interval; B = SDNN; C = RMSSD; D = PNN50%. S 20 = 10 sprints series (all-out) of 30 meters with 20 seconds of recovery; S 30 = 10 sprints series (all-out) of 30 meters with 30 seconds of recovery S 40 = 10 sprints series (all-out) of 30 meters with 40 seconds of recovery.

A = LF; B = HF; C = LF / HF. S 20 = 10 sprints series (all-out) of 30 meters with 20 seconds of recovery; S 30 = 10 sprints series (all-out) of 30 meters with 30 seconds of recovery S 40 = 10 sprints series (all-out) of 30 meters with 40 seconds of recovery.
Regarding performance between sprints (Fig. 6), intra-condition (between all sprints), and inter-condition comparisons (for the same sprint, ex: 1st sprint S 20versus 1st S 30, and successively) were used. However, for none of the moments used for comparison with all conditions, a significant difference was found (p = 0.979).
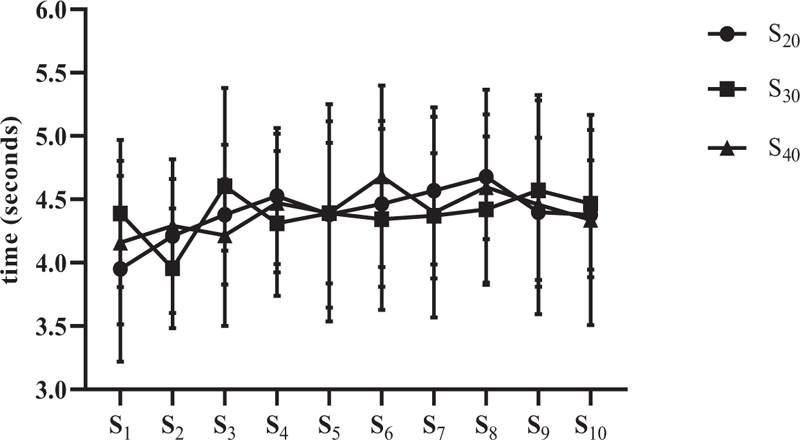
S20 = 10 sprints series (all-out) of 30 meters with 20 seconds of recovery; S30 = 10 sprints series (all-out) of 30 meters with 30 seconds of recovery S40 = 10 sprints series (all-out) of 30 meters with 40 seconds of recovery.
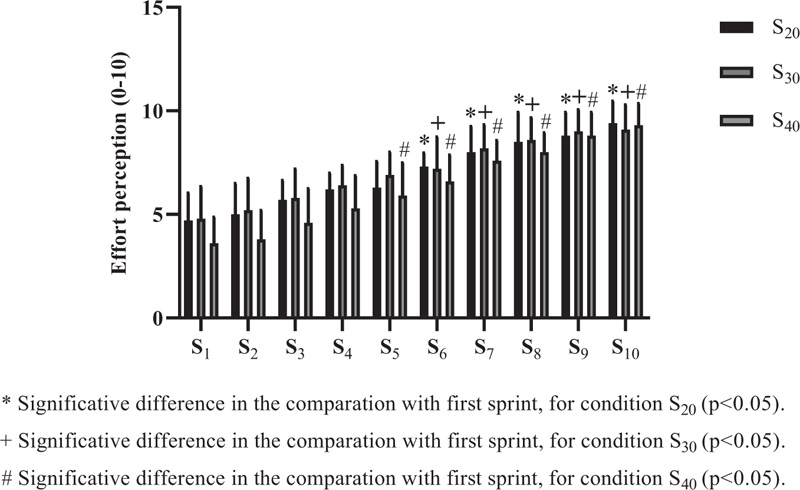
S20= 10 sprints series (all-out) of 30 meters with 20 seconds of recovery; S30 = 10 sprints series (all-out) of 30 meters with 30 seconds of recovery S40 = 10 sprints series (all-out) of 30 meters with 40 seconds of recovery.
Effort perception (0-10) was applied after each sprint for all conditions (Fig. 7). For S 20 and S 30, significant differences were observed from the sixth sprint (p=0.002 and p=0.008, respectively). In the S 40, significant discrepancies started from the fifth sprint (p=0.016). Regarding the inter-condition comparisons, they were performed between the same sprints (1st sprint S 20versus 1st sprint, S 30, and successively), but no significant difference was found (p>0.05).
4. DISCUSSION
The present study aimed to analyze the acute effects of different intervals (20, 30, and 40 seconds) between sprints (10 x 30 meters) in blood pressure, heart rate variability, lactate, and performance responses in physically active male subjects. Usually, there is a pattern of recovery time (partial or complete) for different variations of high-intensity interval training, which can be 2 to 4 minutes (passive or active) for SIT, up to 60 seconds (passive or active) for RST, and 1 minute or more (passive or active) for HIIT [5]. However, the present study chose to outline protocols with short stimulus and pause time levels, thus requiring an even more intensive demand in physiological and mechanical responses [8, 42]. The findings of this research suggest that different intervals (below 1 minute) are not significant in terms of variables such as BP, HRV, lactate, and performance. However, studies that can reinforce these results are scarce, making a knowledge gap about the recovery interval between sprints.
In the hemodynamic evaluation, SBP and DBP analyzed pre and post-sprints (for 60 minutes), and MBP was calculated for the same moments. The objective was to see if sprints with different intervals would cause a possible hypotensive effect. However, no significant difference was found in the post (all times) comparison with a baseline for S 20 (p = 0.7428), S 30 (p = 0.9948), and S 40 (p = 0.6349). But still, as a comparison effect, an analysis was performed only in the post intra-conditions based on the post-immediate moment, and significant differences were observed (p <0.05) for condition S 20 for all verification times (10, 20, 30, 40, 50 and 60 minutes). Differences were also observed (p <0.05) in the S 40 condition from 30 minutes to the end of the analysis (60 minutes). No difference was found for S 30 (p> 0.05). These findings suggest that S 20 and S 40 promoted higher parasympathetic reactivation after effort, with S 20 being superior in the possible hemodynamic regulatory action potential. For MBP, in the post comparison, only for S 40, a significant difference was observed, at moments 50 (p = 0.040) and 60 (p = 0.007) minutes. These findings corroborate those by other authors [43] who also did not observe hypotensive effects after acute HIIT sessions. It has been seen that in this study, the IT characteristic was distinct, but also with high intensities.
Additionally, studies demonstrate that HIIT does not promote significance in SBP but DBP [44]. However, it seems that for this type of intervention, including sprints, hemodynamic responses are affected in chronic analyses. Gliemann et al. [45], after eight weeks of training using the high-intensity protocol 30-20-10 [46], observed significant reductions in SBP for normotensive individuals and SBP and DBP for hypertensive patients. However, studies that used sprints (specifically RST) in hemodynamic responses are scarce, making it difficult to reach conclusions about the present study's findings. The possible mechanisms involved in the best BP responses after sprint intervention may be related to the intensity of the stimuli (all-out) that offer an increase in blood flow speed and, consequently, increased nitric oxide levels in endothelial structures [44, 47]. With the increase in endothelial nitric oxide, there is an improvement in the capacity of vasodilation, resulting in more efficient vascularization, which increases peripheral compliance and, as a final product, the reduction of BP [48].
Regarding the autonomic evaluation, HRV was used for this analysis. No significant differences were found (p>0.05) for the applied conditions (S 20, S 30, and S 40). Due to the high sympathetic activation between exercises, the post-effort measurement was performed 50 minutes after the end of the sprint session; the responses did not present statistical significance in the intra- and inter-conditions. This speculation is in line with the findings of the study by Cal Abad et al. [12] who found a very high rate of sympathetic action (identified by the low value of the index lnRMSSD) immediately after performing a repeated sprint skill test session (6 x 40 m: transport sprints - 20 + 20 m with 20 s passive recovery). However, these authors found a significant parasympathetic recovery (lnRMSSD) (p <0.05) after 1 and 2 hours at the end of the sprints, these results being different from the present study. Chronically, it seems that sprint intervention may be an excellent option for improving autonomic function [22]. However, as the present study was conducted acutely, statements for such speculation are inconclusive. The mechanisms that can influence HRV as a result of sprint intervention is that high intensity can increase the contractile capacity of the heart and, as a result, there is an improvement in diastole and consequently in cardiac systolic strength, regardless of neurohormonal (electrical) influences (chemical) [49]. Another impact is that with the intervention with sprints or another characteristic of high intensity IT, there may be a modulation of the calcium concentration (CA +) in the cardiomyocytes, and this improvement in the release and reuptake of CA + promotes cardiac efficiency, facilitating the entry and exit of blood in the heart (diastolic and ejection volume, respectively) [50]. However, these are structural changes in the heart that would influence autonomic improvement. Neural (electrical) differences in responses to sprint interventions are still inconclusive, but exercise (different methods and types) can improve neural function as a whole, thus enabling better HRV as there is greater control and autonomic balance [51].
Lactate was measured pre and post (2 min, 30s) in all conditions. In the intra-condition evaluation, the results were already as expected, significant in the post-period compared to the pre (p <0.0001) and all conditions. When inter-conditions were evaluated (post moment), no difference was found (p> 0.05). There was an accumulation of lactate in shorter recovery intervals compared to longer break times [42, 52]. In the present study, similar results were observed. One of the hypotheses for these findings is that all the recovery times used (20, 30, and 40 s) offered low recovery capacity. Because of that, the removal of lactate was not different. However, studies have shown that the greater the intensity and insufficient recovery, the greater the effectiveness of the metabolic integration, the greater the oxidative participation, and the lactate in the ATP resynthesized in less accumulation of this metabolite [30, 42]. In general, the aerobic system's higher capacity would also enable greater integration of energy metabolisms in high-intensity activities, thus preserving the glycolytic system a little more [1].
In the performance analysis, intra and inter-condition evaluation was carried out for all sprints performed, based on the first sprint and between them when the inter condition comparison was performed. However, no significant difference was found (p> 0.05). These findings differ from classic studies that, even in different characteristics, observed a significant loss of performance [30, 42, 52]. On the other hand, interventions with sprints or HIIT itself are efficient in improving the performance of different tests for functional analysis [6, 9, 10]. Studies suggest that the improvement in aerobic capacity [3], density and mitochondrial biogenesis [19, 20], greater glycolytic and oxidative efficiency [16, 17], and faster muscle adaptation [18] are the primary mechanisms for improving performance. In our findings, to help monitor intensity, the Borg scale (EP - 0-10) [41] was used, and for sprint intensity control and monitoring, PE is an excellent tool for use [53]. Higher perception (compared to the 1 st sprint) was found from the six sprints to S 20 and S 30 and interestingly, from the 5th sprint to S 40 (p <0.05).
Interestingly, the results at the time of the first (between conditions) sprint were different (but without a significant difference). All participants performed warming up similarly (at relatively equal intensity). Above all, it seems that this discrepancy did not change the performance of the other sprints. These results help identify that the more sprints the individuals had, the higher the fatigue; however, they managed to maintain their performance. The present study demonstrated similar results between different interval times. On BP, other studies have also not shown significant developments in this variable's behavior [43], but we can say that high-intensity interval training can be a great strategy in chronic BP improvement [44].
With regard to HRV, studies have shown positive results in this functionality after intervention with sprints [22]. In the present study, it was not possible to observe (statistically) significant differences. In lactate, interventions of the type applied here can promote a high level of metabolic integration [16, 17], which would require less glycolytic system and, as the interval times were little different from each other, it may have reached similar levels in the metabolic demand and thus demonstrated reactions similar in lactate. In performance, studies carried out similar protocols and observed results different from ours [30, 42, 52], but on a cycle ergometer, which would explain a greater energy demand because of the greater muscular (mechanical) demand.
There were some limitations of this study. One of which is the sample size, which, from the sample calculation (G-Power 3.1), has been designated a minimum of 12 people for higher statistical sensitivity. The difficulties in selecting individuals that fit the study criteria were carried out with ten individuals. Another limitation was the lack of a photocell device to measure the sprint time, but our findings were not different from studies that used approximate distance used here [10]. Another issue that we assumed as a limitation was a test's performance to compare intensity (tested) with that applied (all-out). The results of the effort's subjective perception demonstrated that the individuals carried out the interventions in efforts considered all out. The scarcity of reviews on different sprint intervals made it challenging to argue the findings, limiting possible speculations on the subject. Finally, the intervention of this es everything was sharp, restricting us to say if s sprints (RST) are indeed positives for tests applied. Therefore, it is recommended to carry out other studies with different types of intervals to evaluate these variables to have more information on the theme of this research.
CONCLUSION
The present study demonstrated that different intervals did not reflect significant differences in hemodynamic, autonomic, lactate responses, and in the performance of active individuals submitted to sprint sessions (10 x 30m all out). However, other studies on this study's theme are suggested to form different opinions and reduce knowledge gaps related to the issue. The present study has a proper use in practical applicability because it offers essential parameters for prescription with sprint, which are identified by easily accessible measurements. Also, the study applied a protocol (10 x 30 m all out) with different recovery times (20, 30, and 40 seconds), which can serve as a training strategy (for health or performance) at different levels of physical conditioning. The responses of these protocols in the individuals were similar. Even if no significant differences (statistics) were observed, this type of intervention could be a great option in high-intensity interval training prescriptions, in the present study, the RST.
ETHICS APPROVAL AND CONSENT TO PARTICIPATE
The study was complied with Resolution 466/12 of the National Health Council (CNS) and was approved by the local Ethics and Research Committee of the Federal University of Juiz de Fora MG, Brazil.
HUMAN AND ANIMAL RIGHTS
No animals were used for this study. All human research procedures performed in the current study followed the institutional and national research committee's ethical standards and were in compliance with the 1964 Helsinki declaration and its later amendments or comparable ethical standards.
CONSENT FOR PUBLICATION
All participants were informed about the protocol and gave their written informed consent before participating in the study.
AVAILABILITY OF DATA AND MATERIALS
The data sets analyzed during the current study are available with the corresponding author [Sant' Ana LO] and can be obtained on immediate request.
FUNDING
None.
CONFLICT OF INTEREST
The authors declare no conflict of interest, financial or otherwise.
ACKNOWLEDGMENTS
Federal University of Juiz de Fora, Minas Gerais, Brazil. For the scholarship to the researcher and Ph.D. student in Physical Education Leandro de Oliveira Sant'Ana.

