All published articles of this journal are available on ScienceDirect.

Acute Effects of Foot Reflexology Massage on Arterial Pulse Wave Characteristics after Aerobic-based and Anaerobic-based Intermittent Exercises: A Preliminary Study
Authors Info & Affiliations
Abstract
Aims:
This study used pretest-posttest randomized group comparison to investigate the acute effects of foot reflexology massage (FRM) intervention on the pulse harmonic and parasympathetic modulation after repeated sprint ability test (RSA) and Yo Yo intermittent recovery test level 1 (YOYO).
Background:
The arterial pulse wave characteristics (APW) is a physiological indicator of peripheral arterial compliance. Reflexology massage is a non-invasive intervention to improve arterial compliance. However, the acute effect of FRM on APW after intense exercise has not been examined.
Objective:
The purpose of this study was to investigate the acute effect of FRM after short-term bouts of anaerobic-based and aerobic-based intermittent exercises.
Methods:
Twenty-six collegiate male football/futsal players voluntarily participated in this study. All participants were randomly assigned to FRM group (n = 14) or control group (n = 12). The participants performed RSA and YOYO exercise protocols at least 3 days apart within a week. The electrocardiography (ECG), and APW of right hand (RH), left hand (LH), and left foot (LF) were recorded for 10 min in supine position before and after interventional/control period. A standard of 30 min FRM was given immediately after exercises, whereas those of control group were requested to rest comfortably on a massage table for 30 min. Non-parametric statistical analyses (The Mann-Whitney rank and Wilcoxon signed rank test) were used to compare the measured variables.
Results:
The results showed different characteristics of sympathetic nervous system index after RSA and YOYO protocols in the FRM and control groups [FRM: RSA (p = 0.01); Control: YOYO (p < 0.01)]. The results also identified similar exercise-induced modulation of 1st and 2nd pulse harmonics in LF location with or without FRM treatment.
Conclusion:
The FRM intervention demonstrated minor impact on the recovery of APW and parasympathetic modulation after RSA and YOYO exercises.
Clinical Trail Registration Number: NCT03821805
1. INTRODUCTION
Reflexology massage is a popular modality in complementary and alternative medicine. The techniques of reflexology massage include clamping, push, slip, buckle, and traction applied to reflex areas in the upper and lower extremities in an attempt to trigger sensory feedback via reflex loop [1]. One branch of reflexology massage is foot reflexology massage (FRM) which provides physical stimuli to elicit somatosensory responses to change haemodynamic and nerve impulse notions [2]. Moreover, FRM can immediately improve central mechanisms [3] and autonomic nervous system (ANS) activity [4-6].
The positive benefits of FRM on cardiovascular function have been documented in the literature. Hughes et al. [4] showed that a 20-min FRM intervention improved blood pressure and heart rate (HR) responses after the Stroop test and a mental arithmetic test. It was also found that synchronized mechanical stimulation on reflexology points through FRM can enhance the HR variability (HRV) in healthy adults [7]. Increased vagal tone and decreased sympathetic modulation and arterial blood pressure were also observed after a 60-min FRM in healthy adults and patients with coronary artery disease [6]. In addition, our recent study using FRM as a short-term recovery intervention demonstrated positive benefits of autonomic function after repeated sprint ability (RSA) exercise in collegiate athletes [8]. Parasympathetic activity and sympatho-vagal balance after repeated sprint performance can be immediately increased by an FRM intervention in collegiate athletes. Moreover, the moderate effect of FRM on HR, HRV, blood pressure, stroke volume, and cardiac output were reported when 5-min FRM intervention was applied to the upper part of the left foot [9].
Arterial pulse wave characteristics (APW) has been used to assess the cardiovascular functions in clinical and applied sciences studies [10, 11]. The APW is a non-invasive method that analyses peripheral and aortic pulse functions from radial pulse recordings. The factors related to APW include cardiac contractility, total peripheral resistance, and blood constituents [12]. The characteristics of APW have been linked to pathological conditions, such as diabetes mellitus [13], cardiovascular risk [14, 15], and cirrhosis [16]. Additionally, it has been showed that exercise intervention could impose acute change in APW [17]. For example, a single session of Tai Chi Chuan increases the power of 2nd harmonic APW in long-term practitioners, indicating a decrease in vascular resistance after the Tai Chi exercise [17].
The post-exercise patterns of autonomic nervous modulation were shown to depend upon exercise duration and exercise modality [18]. We previously observed that a 30-min FRM intervention could enhance parasympathetic reactivation after RSA in collegiate football/futsal players [8], suggesting that FRM might be used as an exercise recovery strategy in athletic population. However, the association of harmonic patterns between cardiac activity and APW after an FRM intervention remains unclear in our current understanding since peripheral arterial activities could play an important role in the post-exercise recovery of cardiovascular functions. Therefore, the main purpose of this study was to investigate the acute effects of FRM on APW and ANS functions after the RSA and YOYO intermittent exercises. We hypothesised that FRM intervention would influence the pulse harmonic and parasympathetic modulation after RSA and YOYO exercises.
2. MATERIALS AND METHODS
2.1. Experimental Approach to the Problem
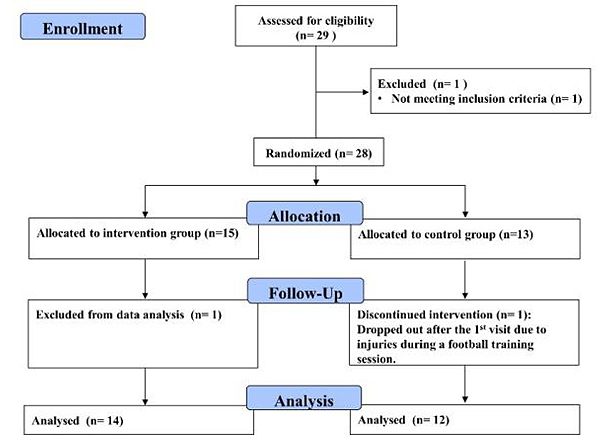
This study used a pretest-posttest randomization group design to investigate the acute effects of FRM on post-exercise recovery of APW and cardiac-related modulation after RSA and YOYO intermittent exercises (Fig. 1). The participants were randomly assigned to the FRM group or control group. Each participant visited our laboratory 3 times for familiarization of RSA, and YOYO exercise protocols (randomly sequenced with at least 72 h between consecutive visits). The experimental intervention and sequence order were conducted via Research Randomizer (https://www.ran domizer.org/). The HRV and APW assessments were conducted at pre-exercise and post-exercise time segments. The experiment was conducted in a university-based exercise performance laboratory.
2.2. Participants
Twenty-nine collegiate male football/futsal players voluntarily participated in this study. The inclusion criteria included: 1) undertaking regular football/futsal training at least 3 times/week; 2) having more than 5 years of football/futsal ages. Exclusion criteria included: 1) history of severe neuromuscular injury; 2) lower extremity injury within 6 months, 3) current neurological or cardiovascular disease. Fig. (1) shows the CONSORT flow diagram of the study. One participant was excluded from the preliminary screening due to inadequate weekly training frequency. Moreover, one participant in the control group was dropped out due to ankle injury after the first trial, while another participant in the intervention group was removed from data analysis due to an incomplete YOYO test. The final number of participants analysed was fourteen in the intervention group (data are presented as median with interquartile range (IQR, Q1 25%-Q3 75%) [9 football/5 futsal; age: 20.9 (20.2-22.3) years, height: 172.3 (170.0-175.1) cm, weight: 67.9 (66.2-71.4) kg, years of play: 9.0 (9.0-12.0) years] and twelve in the control group [7 football/5 futsal; age: 21.0 (20.0-21.8) years, height: 172.6 (169.2-176.6) cm, weight: 66.7 (62.3-69.1) kg, years of play: 12.0 (9.0-12.0) years]. The participants then signed a written informed consent form and undertook a familiarization session before the experiment. The study was approved by the internal review board of the human ethics committee of the University of Taipei (UT-IRB-2016-017) and was conducted according to the Declaration of Helsinki and its later amendments. This study was registered in the ClinicalTrials.gov with an identified number of NCT03821805.
Based on our recent study [8], a power (1-β error probability) of 80% and an alpha value of 0.05 in association with a two-tail test were set to estimate the minimum number of participants. Using G Power 3.1.9.4 software (G*Power, Düsseldorf, Germany) [19], a priori power analysis with means difference between two dependent means (matched pairs) was used to calculate the sample size. The power analysis indicated that a minimum of 14 participants in the intervention group would be required.
2.3. Experimental Procedure
Initially, the participants visited the exercise performance laboratory of the University of Taipei for familiarization. The participants then performed the RSA and YOYO exercise protocols indoors on two separate occasions in randomized order. The participants were informed not to undertake strenuous exercise 24 h before the visits and avoid caffeine-containing substances and smoking 2 h before the experiments.
At the beginning of the experiment, the participants rested for 15 min in the supine position for photoplethysmograhic (PPG) and electrocardiographic (ECG) recording in a quiet research room. Afterwards, the participants undertook a 5-min warm-up cycling exercise on a stationary cycling ergometer (Optibike Med, Ergoline, Germany). The participants wore their personal sports shoes and performed the RSA and YOYO testing protocols on the indoor artificial lane. After the exercise, the participants in the FRM group were given a standard 30-min FRM intervention by a qualified practitioner with a practical experience of 20 years. In contrast, the participants in the control group were requested to rest comfortably on a massage table for 30 min. Post-exercise PPG and ECG were recorded for 15 min after the intervention/control period. The room temperature was controlled at 25 degree centigrade, and the humidity ranged from 50% to 60%.
2.4. Reflexology Intervention
The Father Josef foot reflexology technique was used as the FRM intervention in this study. The participants were set in a medical bed in lying position. The FRM practitioner performed a standard 30 min FRM (15 min/foot) to interventional participants. The non-dominant foot was firstly carried out, followed by the dominant foot. The dominant foot was defined as the preferred leg to kick a football. Table 1 shows the techniques and processes of FRM intervention.
| Reflexology massage technique (each leg 15 minutes) | |
|---|---|
| 1. Preparation phase (2 minutes) | Skin clean, hot pack, rub, knead |
| 2. Operational Phase (12 minutes) | Step 1: Clamping by index finger and thumb finger Step 2: Push by finger pulp Step 3: Slip by index finger joint (basis phalanges) |
| 3. Integrative phase (1 minutes) | Buckle, traction, clean |
2.5. Exercise Protocol
2.5.1. Yo Yo Intermittent Recovery Test Level 1
The YOYO test is an aerobic-based incremental running exercise protocol that was executed by running back and forth across a 20 m distance at a gradually incremental speed. A jogging distance of 5 m recovery zone with 10 s of active recovery time was given to the participants after each bout of running. The participants had to prepare for the next bout of run before a new digital audio bleep was given. The running speed was controlled by digital audio bleeps (MP3 file) from a laptop. The running speeds of the first four bouts were 10-13 km.h-1 (0-160 m) and another seven bouts were 13.5-14 km.h-1 (160-440 m). The running speed then increased by 0.5 km.h-1 after every eight bouts (i.e. 440 m ~ 760 m = 14.5 km.h-1, 760 m ~ 1080 m = 15 km.h-1, 1080 m ~ 1400 m = 15.5 km.h-1, and 1400 m ~ 1720 m = 16 km.h-1, etc.). A violation was recorded if the participant was unable to reach the line at a specified pace. The total covered distance was recorded when the participant was unable to return to the start line in time twice.
2.5.2. Repeated Sprint Ability Test
The RSA exercise protocol was a short-distance all-out repeated sprint test with intraclass correlation coefficient value of 0.81 [20]. The test consisted of 20 m back and forth sprint repeated in 6 times with 20-s rest interval. The participants were given two preliminary trials to familiarize themselves with the RSA, followed by a 5 min rest. A commercial time gate system (Fusion Sport, Coopers Plains, Australia) was set at the starting line with 1.2 m height to assess the RSA time. A research assistant started the countdown rest interval after each bout of RSA. The mean of 1-3 bouts, 4-6 bouts, and 1-6 bouts of RSA performance were recorded as RSA1-3mean RSA4-6mean, and RSA mean, respectively. Fatigue index was calculated by using the following formula: [(RSAworse - RSAbest) / RSAbest × 100 [21].
2.6. Physiological Measures
2.6.1. Electrocardiography
The ECG signals were recorded using a multichannel biosignal recorder (MP35, Biopac Inc., CA, USA). A conventional lead II arrangement was set for ECG configuration. The ECG was measured 15 min before warm up and 15 min after FRM intervention or control period. The first 5-min ECG data were discarded to prevent orthostatic effect. The analog signals of ECG were transformed into digital signals using an analog-to-digital converter with a sampling rate of 1,000 Hz via the Biopac Student Lab system. A custom-written programme was used to analyze the power spectra of 1st harmonic and 2nd harmonic ECG signals (Mathcad version 15, Parmetric Technologies, Natick, USA).
Parasympathetic nervous system index (PNS), sympathetic nervous system index (SNS), and stress index were used as the HRV indices in this study. The ECG waveforms were filtered using the Kubios HRV analysis software Premium version 3.2.0. (Kubios, Kuopio, Finland) to calculate PNS, SNS, and stress index. Medium artefact correction and smoothing priors set at 500 Lambda with window overlap of 50% were used as the detrending method [22]. The PNS index was calculated using meanRR, RMSSD, and SD 1. The SNS index was calculated using mean HR, Baevsky’s stress index, and SD 2. The stress index is the square root of Baevsky’s stress index [23].
2.6.2. Plethysmographic Waveform
The PPG signals were recorded using a multi-channel recorder (MP35, Biopac Inc., CA, USA). The PPG transducers (SS4LA,Biopac Inc, CA, USA) were placed at the right (RH) and left index (LH) fingers and left index toe (LF) to collect the APW. A total of 215 pulse signal data points (amounting to 81.92 s) was used for power spectral analysis via a custom-written programme (Mathcad version 15, Parmetric Technologies, Natick, USA). The major peak in the APW power spectrum was identified as the fundamental frequency and termed the 1st pulse harmonic (power of 1st peak pulse waveform). Consecutive peak located at subsequent frequency was identified and termed the 2nd, pulse harmonic (power of the 2nd peak) [17].
2.7. Statistic Analyses
Statistical analyses were conducted using Sigmaplot version 13 for Windows (Sigmaplot, Systat Software, CA, USA). Descriptive data were presented as mean and standard deviation (exercise performance) or median with IQR (HRV and APW). To avoid daily variation of physical status, the pre-and-post exercise percent change in ECG and APW measures were calculated using the following formula: % Parameter = (Parameterpost – Parameterpre)/ Parameterpre × 100% [24]. An independent sample t test was used to compare exercise performance between the groups. The Mann-Whitney rank sum test was used to compare the differences between-group comparison. The Wilcoxon signed rank test was used to compare the within-group comparison (time frame). In addition, the effect size (ES) in pairwise comparisons was tested using the Cohen d standardized differences. The standardized differences in ES was interpreted as trivial (0.0-0.2), small (0.2-0.6), moderate (0.6-1.2), large (1.2-2.0), or very large (> 2.0) [25]. The alpha level of significant difference was set at p < 0.05.
3. RESULTS
3.1. Exercise Performance
The pairwise comparison did not reveal significant difference in RSA performance between the two groups (p ˃ 0.05; (Table 2). However, there was a significant difference in exercise duration for YOYO performance between the two groups of participants (p = 0.028; ES = 0.90).
| FRM (n = 14) | Control (n = 12) | P-value | Effect Size (95% confident interval) |
|
|---|---|---|---|---|
| 1st RSA (s) | 7.4 (7.1-7.5) | 7.5 (7.3-7.9) | 0.227 | -0.52 (-1.20; 0.12) small |
| 2nd RSA (s) | 7.6 (7.3-7.7) | 7.5 (7.1-8.1) | 0.777 | -0.38 (-1.04; 0.26) small |
| 3rd RSA (s) | 7.7 (7.4-7.8) | 7.6 (7.5-7.9) | 0.738 | -0.26 (-0.92; 0.38) small |
| 4th RSA (s) | 7.7 (7.3-7.8) | 7.8 (7.5-8.2) | 0.368 | -0.52 (-1.19; 0.13) small |
| 5th RSA (s) | 7.6 (7.5-7.8) | 7.8 (7.5-8.0) | 0.247 | -0.56 (-1.24; 0.09) small |
| 6th RSA (s) | 7.7 (7.6-7.8) | 7.8 (7.5-8.0) | 0.520 | -0.36 (-1.02; 0.29) small |
| RSA1-3mean (s) | 7.5 (7.3-7.7) | 7.7 (7.5-8.0) | 0.625 | -0.46 (-1.13; 0.19) small |
| RSA4-6mean (s) | 7.7 (7.5-7.8) | 7.8 (7.6-8.2) | 0.269 | -0.51 (-1.18; 0.14) small |
| RSAmean (s) | 7.6 (7.4-7.7) | 7.8 (7.6-8.2) | 0.292 | -0.48 (-1.15; 0.16) small |
| Fatigue index (%) | -6.7 (-7.8 - -4.6) | -7.6 (-10.9 - -5.1) | 0.247 | -0.58 (-1.38; 0.20) small |
| YOYO test (min) | 10.7 (9.1-13.4) | 8.4 (7.1-10.4) | 0.028* | 0.90 (0.24; 1.61) moderate |
3.2. Heart Rate Variability
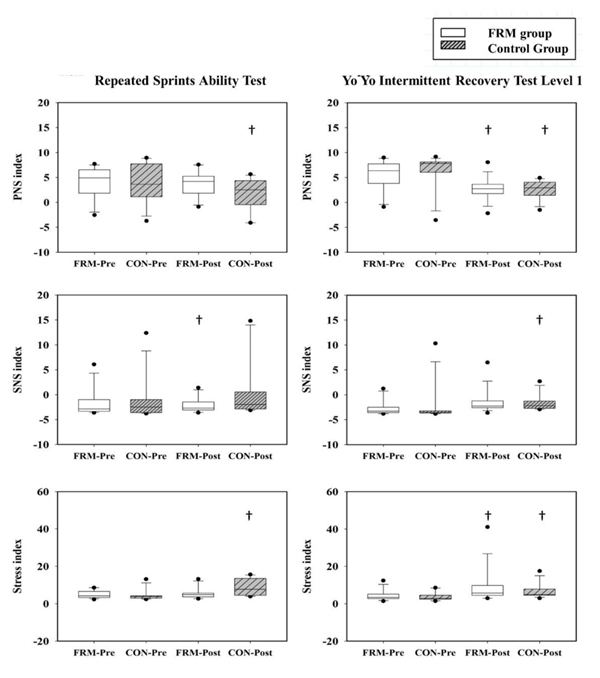
The PNS, SNS, and stress index were found to have significant differences in time comparison (Fig. 2). The PNS index demonstrated significantly lower post-exercise values during RSA protocol in the control group (p < 0.01) and during YOYO protocol in the FRM and control groups (p < 0.01). The SNS index demonstrated significantly higher post-exercise values during RSA protocol in the FRM group (p = 0.01) and during YOYO protocol in the control group (p < 0.01). Moreover, the stress index showed significantly lower post-exercise values during RSA protocol in the control group (p < 0.01) and during YOYO protocol in the FRM (p < 0.01) and control groups (p = 0.03).
3.3. Electrocardiography and Arterial Pulse Waveforms
The ECG showed significant differences in time comparison in HR responses [FRM: RSA pre 55.5 (49.5-61.5) bpm < post 70.5 (62.5-75.8) bpm (p < 0.01); control: RSA pre 58.5 (51.0-80.3) bpm < post 69.3 (63.0-84.0) bpm (p < 0.01); pre 55.5 (51.8-62.3) bpm < post 76.5 (72.8-80.3) bpm YOYO (p < 0.01).
The results of APW demonstrated significant differences in group comparison in the 1st pulse harmonic of pre-exercise RSA LF variable (p = 0.03), the 1st pulse harmonic of post-exercise YOYO LH variable (p = 0.04), the 2nd pulse harmonic of pre-exercise RSA LF variable (p ≤ 0.05), the 2nd pulse harmonic of post-exercise RSA LF variable (p ≤ 0.05). In time comparison, a significantly larger 1st pulse harmonic was found in post-exercise RSA LF (p = 0.04) and YOYO LF (p = 0.01) in the FRM group. Similar findings were also observed in post-exercise RSA LF (p = 0.01) and YOYO LF (p = 0.03) in the control group. Moreover, significantly larger 2nd pulse harmonic was found in post-exercise YOYO LH (p = 0.01), RSA LF (p = 0.04), YOYO LF (p = 0.04) in the FRM group. Similar findings were also observed in post-exercise YOYO LH (p = 0.04), RSA RH (p = 0.03), YOYO RH (p = 0.03), RSA LF (p = 0.02), and YOYO LF (p = 0.02) in the control group (Fig. 3).
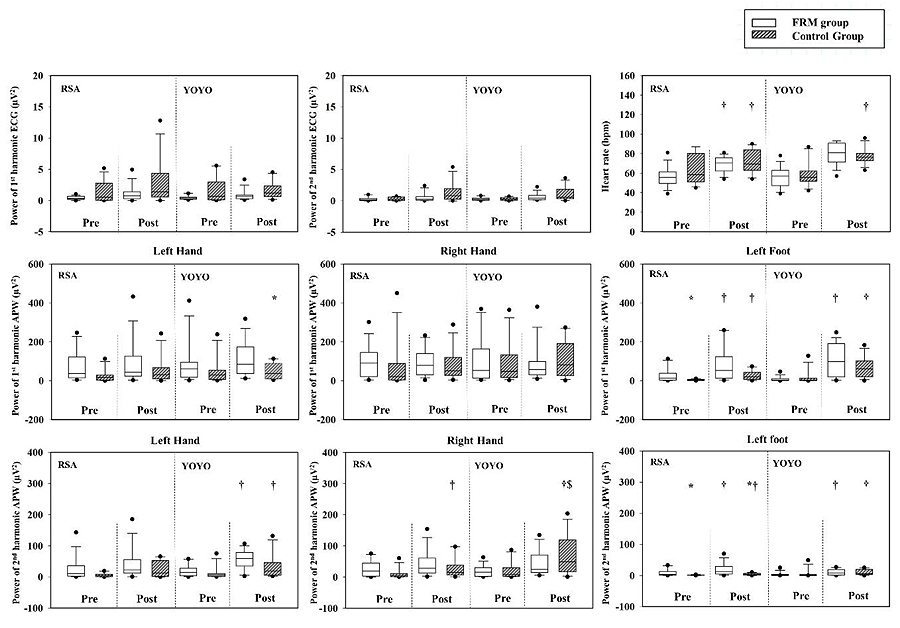
In exercise comparison of APW, a significant difference was found in YOYO RH of the 2nd pulse harmonics in the control group (p = 0.01) only.
In comparison of pre-post percentage change, only HR variable was significantly different in exercise comparison in the control group (p < 0.01; (Table 3).
| FRM (n = 14) | Control (n = 12) | ES (FRM RSA vs YOYO); CI 95% | ES (Control RSA vs YOYO); CI 95% | ES (RSA: FRM vs Control); CI 95% | ES (YOYO: FRM vs Control); CI 95% | |||
|---|---|---|---|---|---|---|---|---|
| RSA | YOYO | RSA | YOYO | |||||
| Heart rate (%) | 23.3 (9.8-37.3) |
43.3 (28.4-53.5) |
18.7 (1.5-43.8) |
29.2 (18.9-55.4) $ |
-1.05 (-1.87; -0.28) moderate | -0.56 (-1.39; 0.24) small | 0.20 (-0.57; 0.98) small | 0.43 (-0.34; 1.22) small |
| Power of 1st harmonics of ECG (%) | 61.3 (13.5-232.8) |
43.9 (19.0-62.9) |
63.1 (1.9-374.0) |
133.1 (-20.6-181.0) |
0.40 (-0.35; 1.15) small | 0.10 (-0.70; 0.91) trivial | -0.27 (-1.05; 0.50) small | -0.42 (-1.21; 0.35) small |
| Power of 2nd harmonics of ECG (%) | 126.8 (6.6-184.4) |
118.2 (21.3-201.8) |
175.4 (12.3-959.3) |
182.8 (71.9-306.4) |
0.26 (-0.48; 1.01) small | -0.35 (-1.16; 0.45) small | -0.06 (-0.84; 0.71) trivial | -0.42 (-1.21; 0.35) small |
| Power of 1st peak of left hand (%) | 21.4 (-46.1-223.6) |
71.7 (11.1-162.3) |
59.6 (-51.1-491.6) |
9.7 (-55.9 -311.0) |
0.04 (-0.70; 0.78) trivial | 0.49 (-0.31; 1.32) small | -0.59 (-1.39; 0.19) small | -0.31 (-1.09; 0.46) small |
| Power of 1st peak of right hand (%) | 12.9 (-22.8-58.4) |
8.9 (-45.4-181.7) |
121.6 (-38.1-711.0) |
-11.4 (-73.0-715.6) |
0.14 (-0.60; 0.88) trivial | 0.16 (-0.64; 0.97) trivial | -0.52 (-1.32; 0.26) small | -0.47 (-1.26; 0.31) small |
| Power of 1st peak of left foot (%) | 671.0 (-9.6-1538.4) |
1196.5 (269.7-8495.4) |
448.6 (71.8-867.6) |
1876.7 (220.1-4667.4) |
-0.73 (-1.51; 0.02) moderate | -0.40 (-1.22; 0.40) small | 0.00 (-0.77; 0.77) trivial | -0.39 (-1.17; 0.39) small |
| Power of 2nd peak of left hand (%) | 113.3 (23.5-521.0) |
269.7 (47.1-1018.1) |
188.0 (8.2-1153.3) |
418.3 (88.2-674.6) |
0.37 (-0.37; 1.12) small | 0.22 (-0.58; 1.03) small | -0.59 (-1.40; 0.18) small | 0.04 (-0.73; 0.81) trivial |
| Power of 2nd peak of right hand (%) | 82.1 (13.0-310.4) |
170.1 (20.0-648.3) |
397.4 (9.6-1661.6) |
216.7 (38.9-2611.7) |
-0.01 (-0.75; 0.73) trivial | 0.15 (-0.95; 0.65) trivial | -0.40 (-1.19; 0.37) small | -0.49 (-1.28; 0.29) small |
| Power of 2nd peak of left foot (%) | 611.1 (1.3-1267.0) |
212.6 (11.4-2308.9) |
173.1 (-5.1-672.9) |
890.3 (98.9-2127.7) |
-0.25 (-0.99; 0.49) small | -0.40 (-1.22; 0.40) small | -0.01 (-0.78; 0.76) trivial | -0.40 (-1.19; 0.37) small |
4. DISCUSSION
The main purpose of this study was to examine the acute effects of FRM on APW and ANS functions after RSA and YOYO intermittent exercises. We hypothesised that FRM intervention would increase the power of the 1st and 2nd pulse harmonic and induce parasympathetic reactivation after the RSA and YOYO exercises. Our findings did not support our hypotheses because the post-exercise FRM effects on arterial vascular modulation and parasympathetic reactivation exhibited non-significant results. These findings were in association with the previous report using sports massage intervention [26].
In order to evaluate the ANS function, the HRV indices were calculated and compared in this study. In group comparison, no significant difference in PNS, SNS, and stress index was observed in the RSA and YOYO tests. In contrast, significant difference of the PNS, SNS, and stress index were found in the pre-exercise and post-exercise comparison in both groups. These findings rejected our hypothesis. As demonstrated in Fig. (2), post-exercise PNS and stress index were significantly decreased during YOYO testing protocol in both groups. While significant decrease in post-exercise PNS and significant increase in post-exercise stress index were observed in the control group only during the RSA testing protocol. This result suggested that the FRM contributed to minor effect on the PNS and stress index since both groups showed similar post-exercise modulation after the RSA and YOYO tests. However, our results showed that the post-exercise SNS in response to the anaerobic-based and aerobic-based intermittent exercise strains were different in both groups of participants. We also found that the post-exercise SNS was significantly increased during RSA test in the FRM group, whereas it was significantly increased during the YOYO test in the control group. The SNS index is a compound HRV metric based on the calculation of mean HR, Baevsky’s stress index, and SD 2. This autonomic parameter is sensitive to acute exercise stimuli [24, 27]. One explanation to our findings was related to the different physiological adjustment of ANS during aerobic and anaerobic exercises [28].
In this study, we used ECG waveform to evaluate the vagal-related activities for better understanding of the vascular compliance to peripheral functions. Our results showed no statistical difference in the 1st and 2nd harmonics of ECG waveforms in pre-and-post exercise and group comparisons. Conversely, in time comparison, a significant increase in post-exercise resting HR was observed during RSA and YOYO tests in both groups (Fig. 3). Cardiac-related mechanisms to regulate heart beat rhythm are complex and are related to the integration of neural responses in the ANS. It is understood that central structures such as brainstem, intra-thoracic cardiac ganglia are mainly responsible for reflex-loop of central mechanisms in the modulation of ANS activities to regulate the HR rhythm [29]. The elevation of post-exercise HR patterns is compromised with metabolic responses, hormonal factors, thermoregulation, and neurophysiological feedback [30].
The vascular function is predominately influenced by vascular sympathetic tone, hormonal regulation, and local status in association with cardiac-related mechanisms [29]. Therefore, the interpretation of vascular compliance is complicate and systematic. In the present study, we found similar exercise-induced modulation of the 1st and 2nd pulse harmonics at LF location with or without FRM treatment. Interestingly, the increase in the power of pulse harmonics depends upon the anaerobic-based and aerobic-based intermittent running exercise. A previous study reported that the height and width of pulse harmonics are effective indicators to evaluate the arterial stiffness [31, 32] and blood distribution to target organs [33]. The first harmonic and second harmonic in the pulse spectra reflects the blood distribution from the aorta to the liver and from the aorta to the kidney, respectively [33]. In the present study, participants in both groups experienced strenuous exercise strains during repeated bouts of running. Exercise-induced decrease in the total peripheral resistance may contribute to the potential role of arterial compliance at the lower extremities after strenuous exercises [34].
The results of the present study may be limited by several factors. Firstly, the perceptual feedback of FRM was not recorded during the intervention. Individual preference and variation in pain feedback during FRM invention may cause a difference in reflex-loop actives among the participants. Secondly, a significant difference in exercise duration during the YOYO test (i.e. total covering distance during YOYO test; FRM = 10.7 min vs Control = 8.4 min) may cause a potential bias for pre-and-post and group comparisons. The battery test used in this study might not solely underpin the outcomes of measurement in the present study. Lastly, the participants’ training status varied in the FRM and control groups (i.e. pre-season competition or in-season competition). Their physical capacity and psychological conditions in relation to their training adaptation of sports events could be a limitation of this study.
CONCLUSION
In conclusion, the FRM and control groups demonstrated similar patterns of arterial pulse harmonics in collegiate football/futsal players after the RSA and YOYO tests. The FRM demonstrated a minor impact on the recovery of APW and parasympathetic modulation after the RSA and YOYO exercises. More evidence is needed to warrant FRM intervention to improve post-exercise recovery of peripheral arterial functions after anaerobic and aerobic intermittent running.
ETHICS APPROVAL AND CONSENT TO PARTICIPANTS
This study was approved by the Human Ethics Committee of the University of Taipei (UT-IRB-2016-017).
HUMAN AND ANIMAL RIGHTS
No Animals were used in this research. All human research procedures were followed in accordance with the ethical standards of the committee responsible for human experimentation (institutional and national), and with the Helsinki Declaration of 1975, as revised in 2013.
CONSENT FOR PUBLICATION
Written informed consent were obtained from all participants.
AVAILABILITY OF DATA AND MATERIALS
The datasets and materials used and/or analysed in the present study are available from the corresponding author on request.
FUNDING
This study was supported by a research grant MOST 105-2410-H-845-015 from the Ministry of Science and Technology, TAIWAN, and a grant V96S4-019 from Taipei Veterans General Hospital, Taipei, Taiwan.
CONFLICT OF INTEREST
Dr. Yung-Sheng Chen is the editorial board member of the journal “The Open Sports Science Journal”.
ACKNOWLEDGEMENTS
The authors would like to thank the players who volunteered to participate in this study.