All published articles of this journal are available on ScienceDirect.

Dietary Determinants Associated with Low Energy Availability among Athletes: A Scoping Review
Abstract
Introduction
Globally, a high prevalence of Low Energy Availability (LEA) (< 30 kcal·kg−1 FFM) is observed among competitive athletes. A comprehensive review of various factors associated with dietary intake will provide a better perception of management strategies for improving food intake and population-specific areas of future research. Thus, this study is aimed at identifying the diverse factors that influence dietary energy intake in relation to Energy Availability (EA) among male and female athletes who engage in training and competition across various sports.
Methods
Five search engines were searched using nine keywords, and original papers were extracted spanning over two decades (2003-2023). A predetermined participant-concept-context criterion was used for the inclusion of studies on competitive athletes.
Results
A total of 1462 studies were identified, of which 53 were deemed suitable for inclusion in this review. LEA was prevalent among 24% of male and 58% of female athletes globally.
Discussion
LEA was influenced by factors classified in six themes: training/performance demands, psychosocial/cultural influences, dietary practices/nutritional beliefs, environmental/logistical/educational factors, physiological considerations, and methodological issues, requiring culturally tailored biomarkers.
Conclusion
The significant prevalence of LEA globally necessitates culturally tailored causal research and biomarker-informed, standardised Randomized Controlled Trial (RCT) interventions that address multifaceted determinants to effectively prevent LEA.
1. INTRODUCTION
The theoretical framework for physiological dysregulation and negative health and performance outcomes caused by low energy intake relative to energy expenditure in exercising humans is given in the models of Female Athlete Triad (FAT) and Relative Energy Deficiency in Sports (REDs) [1, 2]. Energy Availability (EA), a core component of REDs in exercising populations, as defined by Loucks in 2020, is the daily amount of energy available to sustain all physiological functions outside of exercise, given as the difference between Energy Intake (EI) and Exercise Energy Expenditure (EEE), expressed relative to an individual’s Lean Body Mass (LBM) [1, 3]. Low Energy Availability (LEA) (EA < 30 kcal/kg FFM) during periods of high energy expenditure results from concomitant low EI, which may or may not be accompanied by eating disorders in athletes [4, 5].
Research across various countries has identified several factors contributing to low EI among athletes. These factors include time constraints, financial limitations, inadequate cooking skills, the pressure to maintain a sport-appropriate physique among Australians [6], and training and sport-specific requirements as reviewed in research from the US and Europe [7], although their association with LEA is yet to be established. Current evidence provides country-specific and setting-specific determinants for low EI leading to LEA, reporting several factors in the domains of social and environment, among which “food availability”, “socio-economic status”, “pressure from coaches”, “body shaming”, “competitiveness between teammates”, and “inadequate dietary intake” emerge as key factors associated with LEA [8, 9]. However, no comprehensive review covering the global aspects of diet associated with LEA among competitive athletes is yet available.
Hence, this scoping review has been planned to identify the various determinants of dietary energy intake associated with EA in male and female athletes training for and competing in different sports. This review will provide an overview of the numerous factors linked with inadequate food intake among athletes with LEA around the world. This data synthesis will offer up-to-date, concise information on the dietary determinants linked to LEA. The findings will be valuable for future global research and in developing dietary strategies to prevent REDs in elite athletes.
2. METHODS
The scoping review followed protocol proposed by Arksey & O’Malley in 2005 for data selection [10]. The guidelines for the Preferred Reporting Items for Systematic Reviews and Meta-Analyses extension for Scoping Reviews (PRISMA-ScR) were used for reporting of the study [11].
2.1. Eligibility Criteria
Participants: Studies included ensured that the athletic populations were professional, elite, or competing. All competitive athletes, irrespective of their age, gender, and sport, were included, while recreational and injured athletes were excluded.
Concept: Studies that measured EA among competitive athletes and reported any “dietary determinant”, operationally defined as “any factor that influenced EI”, were included. Other factors reported in these studies were also summarized.
Context: All studies reporting determinants of LEA conducted during any phase of the athlete’s career: training, competition, and/or recovery were included. Athletic phases were not restricted to gaining insight into myriad dietary determinants of LEA among competitive athletes.
Original research, reported in English with a primary, quantitative, qualitative, observational, case-study, or interventional study design, was considered for inclusion. Those not meeting the described Participant- Concept-Context (PCC) criteria were excluded.
2.2. Search Strategy
Available and relevant databases and a grey literature source were searched to identify the full published articles. The research was undertaken on five databases in the following order: Web of Science, SCOPUS, PubMed, ProQuest Dissertations and Theses Global, and Google Scholar. All articles published from January 2003 to July 2023 were included. The search strategy used keywords to download all available research on the topic. The keywords used were “Energy Availability”, “Athlete”, “Energy”, “Diet”, “Food”, “Intake”, “Choice”, “Habit”, and “Practice”. The search terms were combined with Boolean operators (AND and OR), and truncation and wildcard symbols were also used (Appendix 1). Search strings were saved for reference.
2.3. Selection of Relevant Studies
The studies from the databases were downloaded into Microsoft Excel 2023 and collated into one spreadsheet. Later, the duplicates were removed, and studies were screened and selected based on inclusion criteria by two independent reviewers, SG and PRL. The disagreements were resolved by consensus following discussion between reviewers. Inaccessible studies were removed after contacting authors by email, with no response. As a consensus amongst reviewers, no article was rejected due to quality because it captured the maximum number of potential determinants for future research.
2.4. Data Extraction and Reporting
The studies selected were organized in a tabular form with information about the author(s) and year of publication, study design, sample size, gender, age, performance level, sport, origin of study, competitive phase, energy availability assessment method, energy availability cutoff, energy intake assessment method, energy expenditure assessment method, resting metabolism assessment method, body composition assessment method, reporting of energy availability, and concluded dietary determinants.
3. RESULTS
The identification of studies yielded 1462 studies, out of which 53 were found eligible for inclusion in this review. The reasons for exclusion are presented in Fig. (1). The final studies given in Table 1 include 45 primary research studies and 8 theses. The study design as given by the authors was cross-sectional (n = 22) [12-33], observational (n = 9) [13, 34-41], interventional (n = 4) [23, 25, 31, 42], pilot (n = 1) [43], case study (n = 1) [35], and descriptive (n = 2) [44, 45].
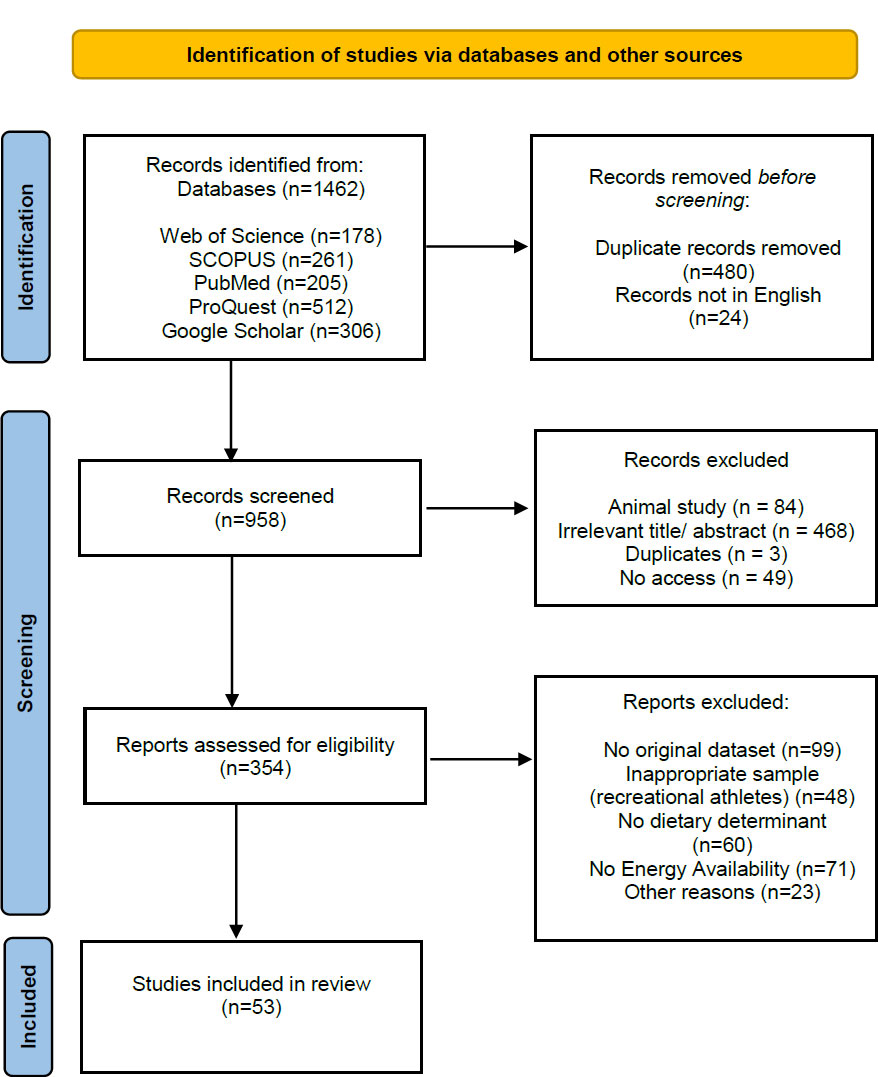
PRISMA flow diagram of the study selection process.
| Author(s) and Year | (Melin et al., 2016) | (Cherian et al., 2018) | (Silva & Paiva, 2015) | (Hertig-Godeschalk et al., 2023) | (Ong & Brownlee, 2017) | (Coelho et al., 2013) | (Logue et al., 2019) |
|---|---|---|---|---|---|---|---|
| Reference | [12] | [13] | [56] | [43] | [60] | [14] | [15] |
| Study design | Cross-sectional | Cross-sectional and observational | NA | Pilot | NA | Cross-sectional controlled | Cross-sectional |
| POPULATION | |||||||
| Sample size | n=25 | n=40 | n=67 | n=14 | n=11 | n=24 | n=833 |
| Gender | Female | Male (n=21) Female (n=19) | Female | Male (n=6) Female (n=8) | Female | Female | Female |
| Age (years) | 18 to 38 | Under-12 and Under-16 | 18.7 ± 2.9 | 34 ± 9 | 21 to 26 | 12 to 19 | 18 and above |
| Performance level (as described by authors) | National | National | International | Elite | Elite | Competitive and sedentary control group | International (n=162), National (n=155), Competitive (n=281), Recreational (n=235) |
| Sport(s) | Weight-sensitive endurance | Soccer | Rhythmic Gymnastics | Multiple wheelchair | Dragon boat race | Tennis | 38 different sports |
| CONTEXT | |||||||
| Origin | Denmark | India | Portugal | Switzerland | Singapore | Brazil | Ireland |
| Competitive phase | During training | Pre competition | Pre competition | Pre competition and Competition | During training | Training | NA |
| CONCEPT | |||||||
| Energy Availability assessment method | Calculated using EI, EEE and FFM | EI – EEE Represented in terms of kcal·kg−1 fat-free mass | EI - EEE Normalised to FFM | EI - EEE Relative to the FFM | EI (kJ) - EEE (kJ))/FFM (kg) | EI - EEE Normalized to FFM | LEAF-Q |
| Energy Availability cutoff (in study) | LEA = <30 kcal (125 kJ)/kg FFM/day; Reduced EA = <45 kcal (188 kJ)/kg FFM/day | LEA = <30 kcal·kg -1 FFM; Adequate EA = ≥30 kcal·kg−1 FFM | LEA = <45 kcal/kg FFM/day | LEA = ≤30 kcal/kg FFM/day | EA detrimental to health = <125.5 kJ/kg body fat-free mass/day; EA maintain normal physiological functions = ≥188 kJ/kg/day | LEA <45 kcal/kg FFM/day | At risk of LEA = score ≥8 |
| Energy Intake assessment method | 7-day weighed food records | 3-days 24-hour dietary recall | 24 hr dietary recall | 3-days weighed food intake diaries | 3-day food dairy | 3-day food records | NA |
| Exercise Energy Expenditure assessment method | MET values of physical activities (Ainsworth compendium 2011) | Portable metabolic analyzer | MET values of physical activities (Ainsworth compendium 2011) | Recommendations of Conger and Basset | SensewearTM armband | Using the compendium of energy expenditures for youth (Ridley, Ainsworth, & Olds, 2008) | NA |
| Resting metabolic rate assessment method | NA | NA | Cunningham equation | NA | Wong, J. E. et al., for Southeast Asian athletes | NA | NA |
| Body composition assessment method | DXA | Skinfold measurements and body plethysmography | Bio-impedance analysis | DXA | Portable bioelectrical impedance monitor | DXA | NA |
| OUTCOME | |||||||
| Energy Availability reported | LEA = 3 subjects Reduced EA = 11 subjects | LEA = 5 boys; U16=4 LEA = 11 girls; U16=7 | LEA below 45 kcal/kg FFM/day = 37.3% gymnasts EA below 30 kcal/kg FFM/day = 44.8% of gymnasts | All of the athletes experienced LEA for at least one day | Energy availability <188 kJ/kg FFM/day = 8 Energy availability <125.5 kJ/kg FFM/day = 6 | Low energy availability = 91.7% of athletes Low energy availability = 71.4% of controls | At risk = Almost 40% (39.7%, n = 331) |
| Dietary determinants concluded | Training load, energy density, weight cutting, appetite, meal composition | Energy density, age, meal timing, ad libitum intake, food familiarity | Competitive phase | Refuelling resources, training load, meal timing, meal composition, body image | Weight cutting, competitive phase (preparation) | Weight cutting, disordered eating, training load, meal composition | Restrictive diets, meal composition |
| Author(s) and Year | (Magee et al., 2020) | (Matt et al., 2022) | (Traversa et al., 2022) | (Vescovi & Van Heest, 2016) | (Macuh et al., 2023) | (Taylor et al., 2022) | (Otte et al., 2023) |
|---|---|---|---|---|---|---|---|
| Reference | [34] | [16] | [46] | [35] | [61] | [36] | [17] |
| Study design | Observational | Cross-sectional | NA | Observational case Study | NA | Observational | Cross-sectional observational |
| POPULATION | |||||||
| Sample size | n=18 | n= 41+31 | n=15 | n=1 | n=23 | n=10 | n=19 |
| Gender | Female | Female (n=41+19) and Male (n=12) | Female | Female | NA | Male | Female |
| Age (years) | 19.2 ± 1.1 | 14 to 17 | 20.5 ± 0.4 | 19 | 18 to 31 | 22 ± 8 | 24 ± 5 |
| Performance level (as described by authors) | National collegiate | High school competitive | University union | Junior elite | Professional | Elite | Competitive |
| Sport(s) | Soccer | Endurance running | Rugby | Triathlon | Football | Road-cycling | Football |
| CONTEXT | |||||||
| Origin | US | US | Canada | Canada | Slovenia | UK | Australia |
| Competitive phase | Season midpoint | Beginning of season | Practice Day, Recovery Day and Game Day | Training | Preparation | Pre-season training | Pre-season |
| CONCEPT | |||||||
| Energy Availability assessment method | EI - EEE Expressed as kcals per kilogram of FFM; LEAF-Q | NA | (EI - EEE)/kg FFM | EI - EEE expressed as kcal/kg FFM/day | EI (kcal) - EEE (kcal) / FFM (kg) | EI – Net EEE / FFM | LEAF- Q |
| Energy Availability cutoff (in study) | LEA = <30 kcal/kg of FFM; At LEA risk = Score ≥8 on LEAF-Q | LEA = <30 kcal/kgFFM/day; Suboptimal EA (male) = 30-45 kcal/kgFFM/day; EA = >45 kcal/kgFFM/day | Optimal EA = >45 kcal/kg FFM/day; Moderate EA = 30–45 kcal/kg FFM/day; Poor EA = <30 kcal/kg FFM/day | LEA = <30 kcal/kgFFM/day | Clinically LEA = <30 kcal/kg FFM Subclinical LEA = 30 - 40 kcal/kg FFM Optimal or high EA = >40 kcal /kg FFM | NA | At LEA risk = Score ≥8 on LEAF-Q |
| Energy Intake assessment method | 4-day diet logs | 2005 FFQ and 2014 FFQs | 7-day dietary record | 3–5 days diet logs | 3-day food diaries | 7 days remote food photography method (RFPM) | 3-day weighed food records |
| Exercise Energy Expenditure assessment method | Wearable monitoring devices | Actiheart heart rate monitors | Based on lab study performed by Nyman & Spriet in 2021 | Heart rate monitor | MET values of physical activities (Ainsworth compendium 2011) | MET values of physical activities (Ainsworth compendium 2011) | Global Positioning System (GPS) monitors |
| Resting Metabolic Rate assessment method | NA | NA | Harris-Benedict equation | Harris-Benedict equation | NA | Harris-Benedict equation | NA |
| Body Composition assessment method | Air displacement plethysmography | DXA and BIA | Bioelectrical impedance analysis (BIA) | DXA | BIA | Assumed 13% body fat | Portable BIA |
| OUTCOME | |||||||
| Energy Availability reported | LEA in 66.7% athletes (23.0 ± 5.7 kcals/kg FFM); Non-LEA in 6 athletes (36.4 ± 7.3 kcals/kg FFM); At LEA risk = 56.3% of athletes | EA (<30) = 36 athletes (female=33; male=3) EA (30-44.99) = 18 athletes EA (>45 kcal/kgFFM/day) = 16.4% of the total sample | Mean EA over the 7-day period was: Forwards = 29.0 ± 3.7 (kcal/kg/FFM/day); Backs = 33.3 ± 3.5 (kcal/kg/FFM/day); 86% of players did not achieve optimal EA | Energy availability observed = <30 kcal/kg FFM/d | Energy availability = 29 kcal/kg FFM | EA = (−)21.9 to 76.0 kcal · kg FFM−1 · day−1 | At risk of LEA = 42% athletes |
| Dietary determinants concluded | Refuelling resources, Nutritional knowledge, Performance level | Gender, disordered eating | Playing position, competitive phase, appetite, training load, external stress | Inadvertent undereating, training load, time constraints, convenience, appetite | Food beliefs, training load, supplement use | Appetite, weight cutting, training load, nutritional knowledge, time constraints, intake assessment, food choices, competitive phase (training day) | Competitive phase, nutritional knowledge, time constraints, training load, appetite, gut health, employment status (time), convenience |
| Author(s) and Year | (L. C. de Souza et al., 2023) | (Silva et al., 2018) | (Dasa et al., 2023) | (Jesus et al., 2022) | (Condo et al., 2019) | (Zabriskie et al., 2019) | (Robbeson et al., 2013) |
|---|---|---|---|---|---|---|---|
| Reference | [18] | [19] | [37] | [38] | [20] | [47] | [21] |
| Study design | Cross-sectional | Cross-sectional | Prospective observational | Observational | Cross-sectional | NA | Cross-sectional descriptive |
| POPULATION | |||||||
| Sample size | n=24 | n=82 | n=51 | n=88 | n=30 | n=20 | n=16 |
| Gender | Female | Female (n=61) and Male (n=21) | Female | Male (n=64) and Female (n=24) | Female | Female | Female |
| Age (years) | 19.5 ± 1.3 | 12.8 ± 3.1 | 22 ± 4 | 16 to 35 | 18 to 35 | 20.4 ± 1.8 | 18 to 30 |
| Performance level (as described by authors) | National Collegiate | Competitive | Elite | National and International | Elite | National Collegiate | University and higher |
| Sport(s) | Acrobatics & Tumbling (A&T) | Acrobatic gymnastics (ACRO) | Football | Basketball (n = 29), Handball (n = 7), Volleyball (n = 9), Swimming (n = 18), and Triathlon (n = 25) | Australian Rules Football | Lacrosse | Track and field |
| CONTEXT | |||||||
| Origin | US | Portugal | Norway | Portugal | Australia | US | South Africa |
| Competitive phase | Training | Competition | Training and match | Preparation and competition | Pre-season | Entire season | In season |
| CONCEPT | |||||||
| Energy availability assessment method | TEI – EEE / FFM | EI - EEE Normalised to FFM | [EI – EEE] / FFM | EI (in kcal) − EEE (in kcal)/ FFM (in kg) | LEAF-Q | (EI – AEE)/kg FFM | Mean daily EI (kcal) - Mean daily estimated EEE (kcal)/ FFM (kg) |
| Energy Availability cutoff (in study) | LEA = <30 kcals·FFM−1 | Low energy availability LEA = <45 kcal/kg FFM/day | LEA = <30 kcal/kg FFM/day | Clinical LEA = <30 kcal/kg FFM for both sexes; Subclinical LEA = 30–40 kcal/kg FFM for males or 30–45 kcal FFM for females; Optimal EA = ≥40 kcal/kg FFM for males and ≥45 kcal/kg FFM for females | At risk LEA = score ≥8; Not at-risk LEA = score ≤7 | Clinical LEA = <30 kcal/kg FFM | Low estimated EA = <30 kcal/kg FFM/day; Healthy estimated EA = ≥45 kcal/kg FFM/day |
| Energy intake assessment method | 3-day dietary recall | 3-day food records | 3 (24-hour) diet recalls | NA | 3 (24 h) dietary recalls | 4-day dietary record | 4 (24-hour) dietary recalls |
| Exercise energy expenditure assessment method | Proposed by Beermann, 2020 | MET values of physical activities (Ainsworth compendium 2011) | DLW and GPS data | DLW and MET values of physical activities (Ainsworth compendium 2011) | NA | Physical activity monitor | MET values of physical activities (Ainsworth compendium 2011) |
| Resting Metabolic Rate assessment method | Cunningham equation | Cunningham equation | Cunningham equation; Harris-Benedict equation | Indirect calorimetry | NA | Cunningham equation; Schofield equation | NA |
| Body Composition assessment method | DEXA | Skinfold thicknesses and BIA | DEXA | Air displacement plethysmograph | NA | DEXA scan | DEXA |
| OUTCOME | |||||||
| Energy Availability reported | LEA = 58.3%, n = 14 student-athletes | Female adolescent gymnasts EA = 32.8 ± 9.4 kcal/kg FFM/day; Female children EA = 45.8 ± 8.7 kcal/ kg FFM/day; Male gymnasts EA = 45.1 ± 14.7 kcal/kg FFM/day; Male children EA = 53.8 ± 9.1 kcal/kg FFM/day | LEA on training days = 23% of the players; LEA on match days = 36% of the players | Clinical low EA at the preparatory phase = Eleven athletes (12.5%) | At risk of LEA = 30% of players | EA (phase 1) = 30.4 ± 11.0 kcal/kg FFM; EA (phase 2) = 26.2 ± 10.5 kcal/kg FFM; EA (phase 3) = 22.9 ± 8.5 kcal/kg FFM; EA (phase 4) = 28.7 ± 9.5 kcal/kg FFM; EA (phase 5) = 28.9 ± 9.2 kcal/kg FFM | Low estimated EA = Eleven athletes (73.3%) |
| Dietary determinants concluded | Training load, Meal composition (low CHO) | Training load | Competition phase, Food beliefs, Training load | Type of sport, Weight cutting, Competition phase | Restrictive diet, Food beliefs, Nutritional knowledge, Estimated energy requirements, Training load, Food intolerances | Availability, Travel, Competition phase, Training load, Time constraints, Convenience, Education level | Disordered eating, Weight cutting, Body image |
| Author(s) and Year | (Reed et al., 2014) | (Jurov et al., 2021) | (Reed et al., 2013) | (Stenqvist et al., 2020) | (Joaquim et al., 2018) | (Schaal et al., 2017) | (Cook & Dobbin, 2022) |
| Reference | [48] | [22] | [49] | [42] | [57] | [53] | [39] |
| Study design | NA | Cross-sectional controlled laboratory | NA | Prospective intervention | NA | NA | Observational cohort |
| POPULATION | |||||||
| Sample size | Pre-season n=19; Mid-season n=15; Post season n=17 | n=12 | n=19 | n=20 | n=17 | n=9 | n=36 |
| Gender | Female | Male | Female | Male | Male (n=9) and Female (n=8) | Female | Male |
| Age (years) | 18 to 21 | 18 to 35 | 18 to 21 | 18 to 50 | 26 (6.17) | 20.4 ± 0.4 | 23.1 ± 3.9 |
| Performance level (as described by authors) | National Collegiate | Trained (n =3), Well-trained (n = 4) and Professional athletes (n = 5) | National Collegiate | Regional and National | Elite | National | Elite (National and International) |
| Sport(s) | Soccer | Endurance | Soccer | Cycling | Paralympic track and field | Synchronized swimming | Cycling |
| CONTEXT | |||||||
| Origin | US | Slovenia | US | Norway | Brazil | France | UK |
| Competitive phase | Pre-season, mid-season, and post season | Training | Pre-season, mid-season, and post season | Training | Pre-competitive and competitive training | Pre competition | Preparatory |
| CONCEPT | |||||||
| Energy Availability assessment method | EA = EI - EEE relative to kilograms of LBM (kcal. kg–1 LBM) | EA = (EI-EEE)/ FFM | EA = EI - EEE relative to kilograms of LBM (kcal. kg–1 LBM) | EA = (EI [kcal] - EEE [kcal])/(FFM [kg])/day | EA = EI (kcal) - EEex(kcal)/ FFM (kg) | EA = EI - ExEE normalizing the resulting value to lean body mass | EAy = (EI − EEE) ∕ eLBM |
| Energy Availability cutoff (in study) | LEA = <30 kcal. kg–1 LBM; Higher EA = ≥30 kcal. kg–1 LBM, | Optimal EA = ≥40 kcal/kg FFM/day | LEA = <30 kcal. kg–1 LBM; Higher EA = ≥30 kcal. kg–1 LBM, | LEA = <30 kcal·kg−1 FFM·day−1 | Adequate EA = ≥45kcal/kgFFM/day; Reduced EA = 30 to 45kcal/kgFFM/day; LEA = ≤30kcal/kgFFM/day | Energy balanced state EA = 45 kcal.kg/LBM/day; LEA = <30 kcal.kg/LBM/day | EA (healthy physiological functioning) = ~45 kcal·kg LBM−1·day−1; EA (impaired physiological functioning) = <30 kcal·kg LBM− 1·day−1 |
| Energy Intake assessment method | 3-day diet logs | Dietary diaries for 7 consecutive days | 3-day diet logs | 4 four consecutive days weighed and registered dietary inatkes | 4 consecutive days digital worksheet and a photographic record | 4 consecutive days food photographs | 3 consecutive days food records |
| Exercise Energy Expenditure assessment method | Polar Team2 software, heart rate monitors, and purposeful exercise logs | Wearable heart rate monitors | Polar Team2 software, heart rate monitors, and purposeful exercise logs | MET values of physical activities (Ainsworth compendium 2011) | Multidirectional accelerometer | Heart rate monitor | MET values of physical activities (Ainsworth compendium 2011) |
| Resting Metabolic Rate assessment method | World Health Organization equation | Indirect calorimetry: Harris-Benedict equation was used | World Health Organization equation | Indirect calorimetry; Cunningham equation | NA | NA | Harris-Benedict equation |
| Body Composition assessment method | DXA | Bioelectrical impedance device | DXA | DXA | Skinfold measures | Skinfold measurement | Boer formula for men |
| OUTCOME | |||||||
| Energy Availability reported | LEA (preseason) = 5 of 19 (26%); LEA (midseason) = 5 of 15 (33%); LEA (postseason) = 2 of 17 (12%) | EA = 29.5 kcal/kg FFM/ day | LEA (preseason) = 5 of 19 (26%); LEA (midseason) = 5 of 15 (33%); LEA (postseason) = 2 of 17 (12%) | Markers associated with LEA found low T3, lowered RMR, and increased cortisol | LEA (day 1) = 17.6% of athletes; LEA (day 2) = 33.3% of athletes; LEA (day 3) = 33.3% of athletes; LEA (day 4) = 8.3% of athletes | Baseline EA = 25.0 ± 3.2 kcal.kg/LBM/day; ITWK2 EA = 22.3 ± 1.9 kcal.kg/LBM/day; ITWK4 EA = 18.0 ± 2.8 kcal.kg/LBM/day | EA (rest day) = 44 ± 14 kcal·kg LBM−1·day−1; EA (training days) = 16 ± 18 kcal·kg LBM−1·day−1; Mean EA = 25 ± 13 kcal·kg LBM−1·day−1 |
| Dietary determinants concluded | Energy density, Meal composition, Weight cutting | Weight cutting, Training load | Body image, Meal composition, Training load, Inadvertent undereating, Meal preparation (Food availability), Appetite | Training load, Inadvertent undereating, Meal composition | Taste, Athlete-guide, Disability | Appetite, Hormone, Gut health, External stress (social and environmental), Weight cutting, Type of sport, Competition phase, Training load | Training load, Eating disorder |
| Author(s) and Year | (Egger & Flueck, 2020) | (Viner et al., 2015) | (Jurov et al., 2021) | (Kinoshita et al., 2021) | (Torstveit et al., 2019) | (Jurdana et al., 2022) | (Kettunen et al., 2021) |
|---|---|---|---|---|---|---|---|
| Reference | [54] | [58] | [23] | [24] | [25] | [59] | [55] |
| Study design | NA | NA | Intervention cross-sectional controlled laboratory | Cross-sectional | Cross-sectional intervention | Prospective | NA |
| POPULATION | |||||||
| Sample size | n=14 | n=10 | n=12 | n=18 | n=53 | n=10 | n=19 |
| Gender | Male (n=8) and Female (n=6) | Male (n=6) and Female (n=4) | Male | Female | Male | Male | Female |
| Age (years) | 18 to 60 | 29 to 49 | NA | 15 to 19 | 18 to 50 | 15 to 30 | Under-18 |
| Performance level (as described by authors) | Elite (National) | Competitive | National and Professional | Competitive high school | Regional competitive | Competitive Elite | National |
| Sport(s) | Wheelchair | Endurance cycling | Cycling, Triathlon, Endurance | Middle- or Long- distance running | Endurance (Cycling, Triathlon, Long-distance running) | Cycling | XC Skiers |
| CONTEXT | |||||||
| Origin | Switzerland | US | Slovenia | Japan | Norway | Slovenia | Finland |
| Competitive phase | Pre-season | Training and Competition | NA | Training | Training | Competitive training | Preparation |
| CONCEPT | |||||||
| Energy Availability assessment method | (EI - EEE)/kg FFM | {EI – [EEE – (RMR/min × exercise min)]} ·FFM (kg)–1·day–1 | (EI-EEE)/FFM | EI - EEE Adjusted for fat free mass (FFM) | EI - EEE Relative to fat free mass (FFM) | EI - EEE Relative to FFM | EI - EEE Expressed in kcal/kg fat-free mass (FFM)-1/day (d)-1 |
| Energy Availability cutoff (in study) | Optimal EA = ≥45 kcal kg-1 FFM day-1; Suboptimal EA = 30 kcal kg-1FFM day-1 to 45 kcal kg-1FFM day-1; LEA = ≤30 kcal kg-1FFM day-1 | LEA = <30 kcal·kg FFM–1·day–1 | LEA being = <30 kcal/kg FFM/day | LEA = <30 kcal⋅kg−1 FFM⋅d−1; Optimal EA = 45 kcal⋅kg−1 FFM⋅d−1 | LEA = <30 kcal/kg FFM/day | LEA = 30 kcal/kg FFM/day | LEA = <30 kcal/kgFFM-1/d-1; Optimal EA = >45 kcal/kgFFM-1/d-1 |
| Energy Intake assessment method | Weighed 7-consecutive day food diary | 3 days·month–1 | 7 consecutive days food diaries | 7-day dietary records | 3 or 4 consecutive days food logs | 3-day food diaries and photographic records | 48-hour food logs |
| Exercise Energy Expenditure assessment method | Recommendations by Conger & Bassett, 2011 | MET values of physical activities (Ainsworth compendium 2011) | Wearable heart rate monitors | Wearable HR monitor | Heart rate monitor | MET values of physical activities (Ainsworth compendium 2011) | Equations by Charlot, 2014 |
| Resting Metabolic Rate assessment method | Metabolic cart; Equation for SCI by Pelly, 2017 | Cunningham equation | Indirect calorimetry | Whole room calorimeter; Cunningham’s equation | Ventilated hood; Cunningham equation | Handheld indirect calorimeter | Cunningham equation |
| Body Composition assessment method | DXA | DXA | Bioelectrical impedance | DXA | DEXA | BIA | Bioimpedance measurement |
| OUTCOME | |||||||
| Energy Availability reported | LEA = 73% of the days in female athletes LEA = 30% of the days in male athletes | LEA (Pre-season) = 70% athlete; LEA (Competition) = 90% athlete; LEA (Off-season) = 80% athlete | EA reduced by 50% | LEA = 6 of the 18 participants | EA (Lower EXDS) = 41.0 ± 11.0 kcal/kg FFM/day; EA (Higher EXDS) = 35.1 ± 10.3 kcal/kg FFM/day | EA = 35 kcal/kg FFM | Suboptimal EA at HOME = 89% of athletes; Suboptimal EA at CAMP = 58% of athletes; LEA at HOME = 5 (26%) athletes; LEA at CAMP = 7 (37%) athletes |
| Dietary determinants concluded | Weight cutting, Competition phase, Training load, Gender | Food beliefs, Restrictive diets, Weight cutting (Body composition management), Competition phase, Energy Density, Meal composition | Training load | Body image, Ad libitum intake | Eating disorder, Body image | Type of sport, Competitive phase, Training load, Residence, Meal composition (Macronutrient intake) | Nutritional knowledge, Meal composition (macronutrient intake), Resource availability (prepared meal), Training load, Residence |
| Author(s) and Year | (Kuikman, 2021) | (Wright et al., 2014) | (Hoch et al., 2009) | (Torres-McGehee et al., 2021) | (Simič et al., 2022) | (McGuire et al., 2023) |
|---|---|---|---|---|---|---|
| Reference | [50] | [26] | [27] | [28] | [29] | [62] |
| Study design | Survey | Cross-sectional descriptive | Prospective cross-sectional | Cross-sectional | Cross-sectional | NA |
| POPULATION | ||||||
| Sample size | n=642+257 | n=22 | n=80+80 | n=121 | n=27 | n=20 |
| Gender | Female (n = 642) and Male (n = 257) | Female | Female | Female | Male (n=13) and Female (n=14) | Male |
| Age (years) | 18 above | 18 to 30 | 13 to 18 | 19.8 ± 2.0 | 13 to 18 | 18 to 40 |
| Performance level (as described by authors) | Recreational (n = 148/62), Collegiate (n = 217/38), National (n = 156/90), and International athletes (n = 119/66) | University (provincial or national level) | Varsity athletes (n=80) and sedentary students/controls (n=80) | Collegiate athletes and performing artists | Competitive | Elite inter-county |
| Sport(s) | Cycling, long-distance running = 84% (n = 565/188), Soccer, rugby = 8% (n = 32/38), Sprinting, shot-putting = 5% (n = 30/16) ; and Archery, equestrian = 1% (n = 11/0) | Field hockey (n = 9) and netball (n = 13) | Track (n=24), cross-country (n=25), volleyball (n=13), basketball (n=14), soccer (n=24), tennis (n=7), swimming (n=17), golf (n=3) and softball (n=6) | Equestrian (n=28), soccer (n=20), beach volleyball (n=18), softball (n=17), volleyball (n=12), and ballet (n=26). | Climbing | Gaelic football |
| CONTEXT | ||||||
| Origin | Canada | Australia | US | US | Slovenia | Ireland |
| Competitive phase | Training and Competition | Training | NA | Training | Training (selection) | Pre-season and In-season |
| CONCEPT | ||||||
| Energy availability assessment method | LEA (females) = LEAF-Q LEA (males) = Non validated questionnaire | mean EI (kcal) – mean estEEE (kcal)/ FFM (kg) | DI - EEE | [EI - EEE]/kg/FFM | EI - EEE / FFM | EI - EEE Relative to kilograms of lean body mass per day |
| Energy availability cutoff (in study) | At risk LEA = score ≥8 | Low estEA = <30 kcal/kg FFM/day; Optimal estEA = ≥45 kcal/kg FFM/day | LEA = <45 kcal/kg/LBM. | LEA = ≤30 kcal/kg of fat-free fat mass | Optimal EA = 45 kcal/kg FFM/day; Reduced EA = 30–45 kcal/kg FFM/day | High EA = >40 kcal.kg LBM−1.d−1; Optimal EA = ≥40 kcal.kg LBM−1.d−1; Subclinical EA = 30 - 40 kcal.kg LBM−1.d−1; Clinical EA = <30 kcal.kg LBM−1.d−1 |
| Energy Intake assessment method | NA | 3-day diet record | 3-day food diary | 7 consecutive days | 3-day food records | 3 consecutive days photographed diary |
| Exercise Energy Expenditure assessment method | NA | MET values of physical activities (Ainsworth compendium 2011) | Ainsworth compendium of physical activity (1993, 2000, 2008) | SenseWear Armband with an accelerometer | MET values of physical activities (Ainsworth compendium 2000) | MET values of physical activities (Ainsworth compendium 2011) |
| Resting Metabolic Rate assessment method | NA | Cunningham equation | NA | Indirect calorimetry | An integrated software | Cunningham equation |
| Body Composition assessment method | NA | DEXA | DXA | DEXA | BIA | Skinfold measurements |
| OUTCOME | ||||||
| Energy Availability reported | Likelihood of being at risk of LEA was 2.5 times for female athletes compared to controls | Low estEA (24± 12 kcal/kg fat-free mass/day) = 59% of the athletes | LEA in athletes = 36% LEA in sedentary/ control subjects = 39% | LEA = 81% (n=98) participants | Average EA = 27.5 ± 9.8 kcal/kg FFM/day | LEA (at pre-season) = 65% LEA (at in season) = 70% |
| Dietary determinants concluded | Performance level, Disordered eating, Athlete support | Weight cutting (dieting), Training load, Body image, Environment familiarity, External stress (media, peer) | Inadvertent undereating, External stress (culture and media) | Type of sport (clothing), External stress, Competitive phase, Time availability, Team support, Weight cutting, Training load (unaccounted increased EEE) | Inadvertent undereating, Food group avoidance, Restrictive diets | Restrictive diets, Competitive phase |
| Author(s) and Year | (Imandel, 2021) | (Halfacre Katharine L., 2020) | (Peterson, 2018) | (Day, 2016) | (Brown, 2013) | (Nalder, 2012) |
|---|---|---|---|---|---|---|
| Reference | [51] | [30] | [44] | [52] | [31] | [45] |
| Study design | NA | Cross-sectional | Descriptive | NA | Cross-sectional Intervention | Descriptive |
| POPULATION | ||||||
| Sample size | n=92 | n=9 | n=81 | n=25 | n=29 | Athlete (n=22) and non-athlete control (n=22) |
| Gender | Male | Male | Male (n=38) and Female (n=43) | Female | Female | Male |
| Age (years) | 19.8 ± 1.4 | 24 to 35 | 18 to 25 | 19.5 ± 1.8 | 13 to 18 | 18 to 45 |
| Performance level (as described by authors) | Collegiate | Professional (n=6) and amateur (n=3) | Collegiate | Collegiate | High School | Elite |
| Sport(s) | Cross-country and track and field | MMA fighters | Track and field, football, volleyball, soccer, golf, basketball, and tennis | Distance runners, sprinters, hurdlers, and jumpers | Track | Cycling |
| CONTEXT | ||||||
| Origin | US | US | US | US | US | US |
| Competitive phase | Training | Competition (RWL) | NA | NA | Training | Training |
| CONCEPT | ||||||
| Energy availability methodology (described by) | Collegiate Professional Sports Dietitians Association, 2018 | NA | Loucks & Thuma, 2003 | Kopp-Woodroffe, 1999 | Nattiv, 2007 | Nattiv, 2007 |
| Energy availability assessment method | Food energy intake – exercise energy expenditure = energy availability | ALEA = Defined by a negative value for TEA, which is the difference between caloric intake and TEE | DI – ExEE kcal/kg of LBM/day | average daily EI - daily EEE; Converted to an index of EA by dividing EA by kg of FFM | DI - EEE | mean EI – mean EEE normalized for FFM |
| Energy availability cutoff (in study) | LEA = <30 kcal/kg fat-free mass per day; Energy balance = 45 kcal/kg fat-free mass per day | 0 = adequate energy, TEA ≥ 0; 1 = ALEA, TEA < 0 | LEA = <30 kcal/kg of LBM/day; Reduced EA = 30-45 kcal/kg of LBM/day; Adequate EA = ≥45 kcal/kg of LBM/day | EB = ≥45 kcals/kg of FFM/d; Below EB = <45 kcal/kg of FFM/d; Restricted EI = ≤30 kcal/kg of FFM/d | Optimal EA = ≥45 kcal/kg LBM; EA (bone turnover) = <45 kcal/kg LBM; EA (menstrual dysfunction) = <30 kcal/kg LBM; Moderate LEA = <45 but >30 kcal/kg LBM | Energy balance = >45 kcal-kg-1FFM-d-1; suppressed reproductive function and bone formation = <30 kcal-kg-1FFM-d-1 |
| Energy intake assessment method | 24-hour dietary recall | 7-day food journals | 3-days 24 h recall | 3-day diet record | 3 consecutive 24-hour diet recall | 3-day food record |
| Exercise energy expenditure assessment method | MET values of physical activities (Ainsworth compendium 2011) | MET values of physical activities (Ainsworth compendium 2011) | Accelerometers and PA logs | Actigraph GTX3 triaxial accelerometer | MET values of physical activities (Ainsworth compendium 2011) | MET values of physical activities (Ainsworth compendium 2011) |
| Resting metabolic rate assessment method | NA | Cunningham equation | NA | NA | World Health Organization, 1985 | Indirect calorimetry |
| Body composition assessment method | Air displacement plethysmography or DXA | Skinfold measurements | DXA | Skinfold measurements | Bod Pod | Bioelectrical impedance |
| OUTCOME | ||||||
| Energy availability reported | EA <30.0 kcal/kgFFM/day = 35% (n=7) | Negative EA (fight week) = (n=8) 88.9% participants | LEA (males) = n=9; 23.7%; LEA (females) = n=5; 11.6% | Mean EA = 30.8 kcal/kg of FFM/d; EA < 45 kcal/kg of FFM/d = 92% (23 participants); EA < 30 kcal/kg of FFM/d = 52% (13 participants) | Moderate LEA = 50% (n = 11); EA > 45 kcal/kg LBM = 27.3% (n=6); EA < 30 kcal/kg LBM = 22% (n=5) | EA (cyclists) = 17.7 ± 8.9 kcal-kg-1 FFM-d-1; EA (controls) = 33.86 ± 9.8 kcal-kg-1 FFM-d-1; LEA (cyclists) = 91% (n=20); LEA (controls) = 41% (n=9) |
| Dietary determinants concluded | Dietary restraint | Weight cutting (RWL) | Inadvertent undereating | Time constraints, Body image (Attitude about body fat and its relation to performance) | Body image, External stress (media, society) | Restrictive diets, Weight cutting, Performance enhancement |
| Author(s) and Year | (Reed, 2012) | (Moss et al., 2020) | (Villa et al., 2021) | (Muia et al., 2016) | (Kalpana et al., 2023) | (Fenton, 2022) |
|---|---|---|---|---|---|---|
| Reference | [32] | [63] | [40] | [9] | [41] | [33] |
| Study design | Cross-sectional | NA | Observational | NA | Observational | Cross-sectional |
| POPULATION | ||||||
| Sample size | n=19 | n=13 | Pre-teen (n=17) and Teen (n=13) | n=61+49 | n=52 | n=24 |
| Gender | Female | Female | NA | Female | Male | Male (n =10) and Female (n =14) |
| Age (years) | 18 to 21 | 23.7 ± 3.4 | 9 to 12; 13 to 18 | 16 to 17 | 16 to 31 | 16 to 35 |
| Performance level (as described by authors) | Collegiate | Professional | Elite | Competitive athlete (n=61) and non-athlete (n=49) | National | Amateur elite |
| Sport(s) | Soccer | Soccer | Gymnasts | Runners | Kho-Kho | Track |
| CONTEXT | ||||||
| Origin | US | UK | Spain | East Africa | India | New Zealand |
| Competitive phase | Pre, mid, and post season | In season (training and competition) | Training | Training | Training | NA |
| CONCEPT | ||||||
| Energy availability assessment method | EI - EEE Relative to kilograms of lean body mass (kcal/kg LBM) | (EI − EEE)/ FFM | NA | Mean daily EI (kcal ∙ d−1) – Mean daily EEE (kcal ∙ d−1) / Fat-free mass (kg)−1 | EI - EEE Expressed as kcal per kg FFM | Female = LEAF-Q; Male = Gastrointestinal questions from the LEAF-Q, sexual desire inventory (SDI) and the androgen deficiency in aging males (ADAM) |
| Energy availability cutoff (in study) | Low EA = <30 kcal/kg lean body mass | Optimal EA = >45 kcal·kg FFM−1·day−1; Reduced EA = 30-45 kcal·kg FFM−1·day−1; Low EA = <30 kcal·kg FFM−1·day−1 | Optimal EA =r >45 kcal/kg FFM/day; Sub-clinical EA = 30–45 kcal/kg FFM/day; Extreme LEA = <10 kcal/kg FFM | Clinical LEA= <30 kcal ∙ kg FFM−1 ∙ d−1; Subclinical LEA = 30–45 kcal ∙ kg FFM−1 ∙ d−1; Optimal EA = ≥45 kcal ∙ kg FFM−1 ∙ d−1 | LEA = ≤25 kcal per kg FFM | At LEA risk (female) = score ≥8; At risk (male) = score ≥20 |
| Energy intake assessment method | 3-consecutive days diet logs | 5-day weighed food diary | 7-day food diary | 5-day diet record | 1-day direct weighment plus recall method | NA |
| Exercise energy expenditure assessment method | Polar Team2 software, heart rate monitors, and purposeful exercise logs | MET values of physical activities (Ainsworth compendium 2011) | ActiGraph accelerometer | MET values of physical activities (Ainsworth compendium 2000) | MET values of physical activities (Ainsworth compendium 2000) | NA |
| Resting metabolic rate assessment method | Indirect calorimetry; Harris-Benedict equation | Indirect calorimetry; Cunningham equation | World Health Organization (WHO) (2006) | Schofield equation | Cunningham equation | NA |
| Body composition assessment method | DXA | DXA | Bioimpedance analysis | Skinfold measurements | Skinfold measurements | NA |
| OUTCOME | ||||||
| Energy availability reported | Low EA (pre-season) = 9 of 19 (47%); Low EA (mid-season) = 6 of 15 (40%); Low EA (post-season) = 2 of 17 (12%) | Optimal EA = 15% of players; Reduced EA = 62% of players; Low EA = 23% of players | Subclinical EA (Pre-Teen) = 12 (70.6%); LEA (Pre-Teen) = 2 (29.4%); LEA (Teen) = 13 (100%) | Clinical LEA = 17.9% (n = 10/56) of athletes; Clinical LEA = 2.2% (n = 1/45) of non-athletes; Subclinical LEA = 76% participants | LEA = 44% of players | At risk (female) = 8 At risk (male) = 5 |
| Dietary determinants concluded | Competitive phase, body image, resource availability (food availability, affordability), appetite | Training load, meal composition (lack of periodization), inadvertent undereating | Age, athlete support | meal composition, appetite, socio-economic status (financial affordability), planned food plate, attitude (care-free), body image, training load | Training load, food environment, inadvertent undereating | Body image, weight cutting, performance (under fuelling), inadvertent undereating |
Abbreviations: NA= Not Available, EI= Energy Intake, EEE= Exercise Energy Expenditure, FFM= Fat Free Mass, LEAF-Q= Low Energy Availability-Questionnaire, EA= Energy Availability, MET= Metabolic Equivalent of Task, DXA= Dual-Energy X-ray Absorptiometry. BIA= Dual-Energy X-ray Absorptiometry, TEI= Total Energy Intake, DLW= Doubly Labeled Water, DEXA= Dual-Energy X-ray Absorptiometry, LBM= Lean Body Mass, ALEA= Acute Low Energy Availability, TEA= Total Energy Availability, TEE= Total Energy Expenditure.
3.1. Sample
The athletes in the studies were competing at high school (n = 3) [16, 24, 31], university (n = 16) [9, 18, 21, 26-28, 32, 34, 44, 46-52], national (n = 12) [12, 13, 15, 23, 38, 39, 41, 42, 50, 53-55], and international (n = 5) levels [15, 38, 39, 50, 56]. The sports played by athletes in the studies can be categorized into endurance (n = 25) [9, 12, 16, 21-25, 27, 31, 33, 35, 36, 38, 39, 42, 44, 45, 50-52, 55, 57-59], team (n = 22) [13, 17, 20, 26-28, 32, 34, 37, 38, 41, 44, 46-50, 53, 60-63], skill games (n = 8) [18, 19, 27, 28, 40, 44, 50, 56], and power (n = 2) [30, 50]. The majority of the studies were undertaken in the US (n = 16) [16, 18, 27, 28, 30-32, 34, 44, 45, 47-49, 51, 52, 58] and Slovenia (n = 5) [22, 23, 29, 59, 61]. Out of the 53 studies, eleven had an age group less than 18 years [9, 13, 14, 16, 19, 24, 27, 29, 31, 40, 55], four studies belonged to the age group 16-30 years, while 37 had an age group greater than 18 years [12, 15, 17, 18, 20-22, 25, 26, 28, 30, 32-39, 41-54, 56-63].
3.2. EA Methodology
The three main methods described for assessing EA used FFM in the majority (n = 45) of studies [9, 12-14, 18, 19, 21-29, 31, 32, 34-49, 52-63], while a few used LBM (n = 7) and LEAF-Q (n = 6) [15, 17, 20, 23, 32-34, 44, 48, 49, 50, 53, 62]. The cut-off used to classify athletes in the LEA category was < 30 kcal ∙ kg FFM−1 ∙ d−1 or ≤ 30 kcal ∙ kg FFM−1 ∙ d−1 in most studies (n = 35), while in some (n = 4) it was < 45 kcal ∙ kg FFM−1 ∙ d−1 [9, 12, 13, 14, 16, 18, 19, 21, 23-28, 32, 34, 35, 37-39, 42-44, 46-49, 51, 53-63]. The majority of studies (n = 26) utilized 3-day dietary recalls for energy intake assessment [13, 14, 17-20, 25-27, 29, 31, 32, 35, 37, 39, 43-45, 48, 49, 52, 58-62]. The exercise energy expenditure was assessed using MET values (n = 23) [9, 12, 14, 19, 21, 26, 27, 29-31, 36, 38, 39, 41, 42, 45, 51, 56, 58, 59, 61-63], wearable monitors (n = 21) [13, 16, 17, 22-25, 28, 32, 34, 35, 37, 40, 44, 47-49, 52, 53, 57, 60], DLW (n = 2) [37, 38], recommendations of Conger and Basset (n = 2) [43, 54], a lab study performed by Traversa et al. in 2021 (n = 1) [46], and equation by Charlot et al. 2014 (n = 1) [55, 64]. The predictive equations used for assessing resting metabolic rate were the Cunningham equation (n = 15) [18, 19, 24-26, 30, 37, 41, 42, 47, 55, 56, 58, 62, 63], the Harris and Benedict equation (n = 7) [22, 32, 35-37, 39, 46], World Health Organization equation (n = 4) [31, 40, 48, 49], the Schofield equation (n = 2) [9, 47], the equation for Southeast Asian athletes (n = 1) [60], equation for SCI (n =1) [54]. Indirect calorimetry (n = 11) was also used in studies to assess the resting metabolic rate [22-25, 28, 32, 38, 42, 45, 59, 63]. The body composition of the study participants was measured using Dual X-ray Absorptiometry (DXA) scans (n = 23) [12, 14, 16, 18, 21, 24-28, 32, 35, 37, 42-44, 47-49, 51, 54, 58, 63], Bioelectrical Impedance Analyser (BIA) (n=14) [16, 17, 19, 22, 23, 29, 40, 45, 46, 55, 56, 59-61], skinfold measurements (n = 9) [9, 13, 19, 30, 41, 52, 53, 57, 62], air plethysmography (n = 5) [13, 31, 34, 38, 51], and Boer’s formula (n = 1) [39]. 40 out of 53 studies reported participants had EA < 30 kcal ∙ kg FFM−1 ∙ d−1 while four suggested athletes being at risk of LEA [9, 12, 13, 15-18, 20, 21, 22, 24, 26-29, 31-41, 43-49, 51-55, 57, 58, 60-63].
3.3. Dietary Determinants
Various determinants emerged in the review, which were categorized into themes as given in Table 2.
| Theme | Key Determinants |
|---|---|
| 1. Training and Performance Demands | - Increased training loads - Athletic season/periodization - Sport-specific requirements (e.g., weight-class, aesthetics) |
| 2. Psychosocial and Cultural Influences | - Body image concerns - Media and sporting culture pressures - Gender-related vulnerabilities (especially in female athletes) - Psychological stress |
| 3. Dietary Practices and Nutritional Beliefs | - Restrictive diets (e.g., paleo, gluten-free) - Carbohydrate and macronutrient misconceptions - Meal timing constraints - Voluntary intake restriction |
| 4. Environmental, Logistical, and Educational Factors | - Time constraints (academic/workload) - Food availability and affordability - Nutrition knowledge - Parental or coach influence - Access to support staff |
| 5. Physiological considerations | - Appetite suppression from training/intensity - Hormonal influences (e.g., ghrelin) |
| 6. Methodological Considerations | - Underreporting or altered behaviour during assessments |
3.3.1. Training and Performance Demands
Elevated training loads without a proportional increase in EI resulted in LEA in 27 studies [9, 12, 14, 17-20, 22, 23, 26, 28, 35-37, 39, 41-43, 46, 47, 49, 53-55, 59, 61, 63], with a 42% frequency among Australian AFLW females during preseason [17]; 44% Indian Kho-Kho males due to inadvertent undereating [41]. Phases of training affected EA, which decreased to 4.2 kcal·kg−1 FFM·day−1 in multi-sport populations [47], interfacing with weight-cutting practices during particular seasons (n = 16) via dietary restriction for performance or body image considerations [12, 14, 21, 22, 26, 28, 30, 33, 36, 38, 45, 48, 53, 54, 58, 60]. The phases of the athletic season (n = 15) affected dietary intake by elevating energy expenditure [17, 28, 32, 36-38, 46, 47, 53, 54, 56, 58-60, 62], resulting in food shortages due to travel, and imposing time limits (90% competition LEA). Conversely, inadequate nutritional periodisation during load variations and the miscalculation of requirements resulted in inadvertent undereating (n = 9) [27, 29, 33, 35, 41, 42, 44, 49, 63]. Sport-specific requirements, such as weighing in or conforming to clothing in weight-class/aesthetic disciplines (n = 4) [28, 38, 53, 59], led to dietary restriction, with Indian junior males displaying 67.5% LEA from unadjusted demands [13].
3.3.2. Psychosocial and Cultural Influences
Body image concerns resulted in calorie restriction and exercise reliance (n = 11; 40% LEAF-Q at-risk Irish women) [9, 15, 21, 24-26, 31-33, 43, 49, 52], exacerbated by media and sports culture influences, as well as psychological stress leading to undereating (n = 6) [26-28, 31, 46, 53]. Females were more susceptible to disordered eating and had lower EI than males (55% daily LEA vs. 35%; 2.5-fold risk) [16, 50], particularly in US high school endurance runners and Canadian aesthetic groups, where cultural stressors converged with training requirements to maintain restraint.
3.3.3. Dietary Practices and Nutritional Beliefs
The macronutrient composition (n = 12) affected energy density and satiety (n = 4) [9, 12, 13, 15, 18, 42, 43, 48, 49, 55, 58, 59, 63], while misconceptions regarding low-carbohydrate diets for weight management (n = 4) and restrictive diets (n=6; e.g., gluten-free/paleo, food group avoidance) limited intake (30% suboptimal EA among Australian rugby females) [15, 20, 29, 37, 45, 58, 61, 62]. Meal timing constraints associated with training schedules (n = 2) reduced EI even in ad libitum conditions [13, 43], indicating a correlation between nutritional attitudes and performance-driven under-eating across genders, with female-dominant samples showing the highest reduction.
3.3.4. Environmental, Logistical, and Educational Factors
Time limitations due to academic or professional commitments (n = 6) resulted in convenience eating, adversely affecting nutritional adequacy (81% of suboptimal EI among collegiate athletes) [17, 28, 35, 36, 47, 52], further compounded by inadequate knowledge (n = 5); 66.7% of youth in the US/ Finland) [17, 20, 34, 36, 55]. The influence of parents and coaches impacted dietary intake among youth (29.4% pre-teen LEA) [40], whereas food availability and affordability varied according to socioeconomic status, travel conditions, and performance level-elite athletes accessed superior nutrition in contrast to amateurs [28, 40, 50, 57]. Familiarity with the food environment, taste, and buffet/low-calorie planning all had an impact on EI [9, 26, 36, 41, 57], but collegiate class schedules limited eating windows.
3.3.5. Physiological Considerations
Increased training, meal composition, and gastrointestinal health resulted in appetite suppression and lower EI (n = 9) [9, 12, 17, 32, 35, 36, 46, 49, 53]. Ghrelin levels increased as a result of compensatory intake attempts among females [53]. Rest-training energy availability discrepancies (44 vs. 17.7 kcal·kg−1FFM·day−1) highlighted the relationship between training and physiology, particularly in mixed and male cohorts [39, 45].
3.3.6. Methodological Considerations
Underreporting or assessment-induced intake alterations biased results (70-90%; 3-7 day recalls/diaries), inflating LEA through heterogeneous cutoffs (< 30-45 kcal·kg−1 FFM·day−1), EEE records inaccuracies, and cross-sectional predominance confound gender/country-specific interpretations without validation with gold methods [36].
4. DISCUSSION
LEA, defined as < 30 kcal·kg−1 FFM·day−1 [65], manifests globally at 24% among male athletes and 58% among females. This trend is reinforced by recent data indicating 63% RED-S risk and associated performance impairments such as diminished endurance and agility [66]. Despite high rates of LEA, few studies have comprehensively identified all evidence-based dietary factors that promote LEA. Future research using multi-method cohort designs that include biomarkers (e.g., reduced fT3, oestradiol) is recommended to examine dietary components that are specific to culture, gender, and age, allowing for customized interventions, as also demonstrated in recent cohorts.
Training and performance demands significantly hinder EI, with heightened EEE showing strong correlations with LEA, attributed to inadequate periodisation, travel disruptions, appetite suppression, and socioeconomic barriers [36, 37]. Prevalence reported in recent studies indicates LEA among 11–67% of athletes during off-season and preseason/peak periods in team sports [67]. Although mechanistic insights remain limited, emerging data indicate that high training loads may reduce hunger [68]. The future scope of research in this area includes longitudinal Randomized Controlled Trials (RCTs) evaluating phase-specific EI-EEE synchronization, including carbohydrate periodisation during matches, training, and rest days, which is crucial to avert catabolic conditions, while practice tips include energy-dense food consumption during such periods.
Concerns regarding body image, in conjunction with other psychosocial factors such as gender norms, cultural pressures, media exposure, and stress, are significant drivers of low EI. Reduced caloric intake among athletes may be inadvertently promoted by coaches and the media, and female athletes may be more prone to adopt restrictive eating practices [16, 54]. This finding aligns with the current evidence of 2025, which identifies body image dissatisfaction (the pursuit of muscularity/thinness) as a significant pathway to RED-S [69]. Our findings reveal the scope of future population-stratified studies on Eating Disorders (ED) and Disordered Eating (DE) with RCTs focused on gender-specific nutritional counselling, emphasising body image acceptance and coping strategies through comprehensive psychological evaluation.
Inadequate dietary practices directly reduce EI due to macronutrient deficits, restricted diets (such as low-carbohydrate), prevalent myths and beliefs, and time constraints. These diminish energy density and satiety [13]. Currently, educational programmes that improve macro-awareness and efficacy have been reported as a solution [70]. Our data support the need for prospective evaluation of culture-specific attitudes and intake motivators and consistent athlete counselling, supported by various institutional policies and programmes to improve EI.
Lack of nutritional literacy and socioeconomic status are critical factors of LEA, intensified by environmental obstacles including insufficient team support, unfamiliarity with food, and challenges related to availability and pricing [55, 57]. Data from recent publications demonstrate a significant correlation between poor socioeconomic status and limited access to facilities and diminished motivation [71]. Contextual heterogeneity highlights nation-specific processes. Future scope includes country-specific environmental studies underpinning strategic dietary guidelines, emphasising policy-driven access to nourishment for vulnerable populations.
Physiological adaptations resulting from training disrupt appetite regulation and hormonal equilibrium (such as elevated ghrelin levels and dysregulation of PYY/CCK), a domain that remains insufficiently explored, as indicated by neural profiling of postprandial suppression in 2025 [53, 72]. This necessitates, in the future, thorough hormonal phenotyping, particularly in fasting and training conditions, essential for establishing precision nutrition frameworks that improve performance and metabolic health.
Methodological limitations decrease the integrity of LEA data, with insufficient incorporation of Indian biomarkers (e.g., T3, ferritin) for cutoff validation, as critiqued in recent reviews of tool heterogeneity [36, 73]. Standardized, strong designs that use population-specific biomarkers are needed to obtain accurate prevalence metrics.Heterogeneous evaluation modalities for EA produce varying estimates due to the lack of standardised protocols, a shortcoming highlighted by recent studies that call for cohesive multi-method frameworks [74]. Establishing global and population-adjusted standards using gold-standard methods and biomarkers can improve study comparability and clinical applicability.
In summation, the review reveals that LEA is widespread globally and is primarily influenced by factors including training, psychosocial, dietary, socioeconomic, physiological, and methodological aspects. It therefore advocates for RCT-based interventions that are culturally appropriate, biomarker-informed, and standardized.
5. LIMITATION
Due to a scarcity of literature, the review included all study designs, using single-reviewer database searches and no quality exclusions to capture all reported determining factors.
CONCLUSION
The high prevalence of LEA among competitive athletes globally suggests the need to conduct causal research to build a deeper understanding of the various factors leading to inadequate dietary intake among athletes, especially phase-specific, population-specific factors across cultures. This needs to be in conjunction with concomitant investigation of biomarkers and standardized RCTs to examine interventions for the identified factors influencing LEA. This will enable the development of strategic eating plans, counselling, and motivators for effective LEA prevention.
AUTHORS’ CONTRIBUTIONS
The authors confirm contribution to the paper as follows: S.G., P.R.L.: Study conception and design; S.G.: Data collection; S.G., P.R.L.: Analysis and interpretation of results; S.G.: Draft manuscript. All authors reviewed the results and approved the final version of the manuscript.
LIST OF ABBREVIATIONS
| FAT | = Female Athlete Triad |
| REDs | = Relative Energy Deficiency in Sports |
| EA | = Energy Availability |
| EI | = Energy Intake |
| EEE | = Exercise Energy Expenditure |
| LBM | = Lean Body Mass |
| LEA | = Low Energy Availability |
| RCTs | = Randomized Controlled Trials |
| ED | = Eating Disorders |
| DE | = Disordered Eating |
AVAILABILITY OF DATA AND MATERIALS
All the data and supporting information are provided within the article.
ACKNOWLEDGEMENTS
Declared none.
SUPPLEMENTARY MATERIAL
PRISMA checklist is available as supplementary material on the publisher’s website along with the published article.
| DATABASE/DATE | FILTERS | COMMAND LINE |
|---|---|---|
| WOS (14-07-2023) | Search fields: WOS Core Collection All editions, All fields Date: 01-01-2003 to 14-07-2023 | “Energy Availability” AND Athlet* AND “Energy Intake” |
| “Energy Availability” AND Athlet* AND (“Die* Intake*” OR “Die* Choic*” OR “Die* Habi*” OR “Die* Practic*”) | ||
| “Energy Availability” AND Athlet* AND (“Food Intake*” OR “Food Choic*” OR “Food Habi*” OR “Food Practic*”) | ||
| 1 OR 2 OR 3 | ||
| SCOPUS (14-07-2023) | Search fields: Article Title, Abstract, Keywords Year: 2003-2023 | {Energy Availability} AND Athlet* AND “Energy Intake” |
| (“Die* Intake*” OR “Die* Choic*” OR “Die* Habi*” OR “Die* Practic*”) AND {Energy Availability} AND Athlet* | ||
| (“Food Intake*” OR “Food Choic*” OR “Food Habi*” OR “Food Practic*”) AND {Energy Availability} AND Athlet* | ||
| 1 OR 2 OR 3 | ||
| PUBMED (14-07-2023) | Search fields: All fields Date: 01-01-2003 to 14-07-2023 | “Energy Availability” AND Athlet* AND “Energy Intake” |
| “Energy Availability” AND Athlet* AND (“Dietary Intake*” OR “Dietary Choic*” OR “Dietary Habi*” OR “Dietary Practic*”) | ||
| “Energy Availability” AND Athlet* AND (“Food Intake*” OR “Food Choic*” OR “Food Habi*” OR “Food Practic*”) | ||
| 1 OR 2 OR 3 | ||
| PROQUEST (14-07-2023) | Search fields: Full Text(Document Text) Year: 2003-2023 | “Energy Availability” AND Athlet* AND “Energy Intake” |
| “Energy Availability” AND Athlet* AND (“Die* Intake*” OR “Die* Choic*” OR “Die* Habi*” OR “Die* Practic*”) | ||
| “Energy Availability” AND Athlet* AND (“Food Intake*” OR “Food Choic*” OR “Food Habi*” OR “Food Practic*”) | ||
| 1 OR 2 OR 3 | ||
| GOOGLE SCHOLAR (16-07-2023) | Year: 2003-2023 Sort by Relevance | “Energy Availability” Athlete “Energy Intake” |
| “Energy Availability” AND Athlet* AND (“Diet Intake” OR “Diet Choice” OR “Diet Habit” OR “Diet Practice”) | ||
| “Energy Availability” AND Athlet* AND (“Dietary Intake” OR “Dietary Choice” OR “Dietary Habit” OR “Dietary Practice”) | ||
| “Energy Availability” AND Athlete AND (“Food Intake” OR “Food Choice” OR “Food Habit” OR “Food Practice”) | ||
| 1 + 2 + 3 + 4 |