All published articles of this journal are available on ScienceDirect.

Comparing Muscle Oxygenation and Peak Blood Lactate Concentration in Division 1 College Middle-Distance Athletes: A Speed Reserve Ratio Analysis
Authors Info & Affiliations
Abstract
Introduction
Middle-distance running requires a balance of aerobic and anaerobic energy systems, necessitating efficient physiological profiling for optimized training. Performance biomarkers, such as the Speed Reserve Ratio (SRR), have been used to improve training and performance but may not always be practical for routine assessment. Other biomarkers, such as skeletal muscle oxygenation (SmO2) and blood lactate concentration ([La]bmax), may be more cost-effective and easier to integrate into training programs than the SRR. This study investigates the relationship between SmO2 and [La]bmax with SRR in NCAA Division I middle-distance runners to determine whether these physiological markers could serve as viable alternatives for athlete profiling.
Methods
Male NCAA Division I athletes (n = 11) completed a series of sprint trials and incremental treadmill tests to assess SmO2 and blood lactate responses.
Results
The change in skeletal muscle oxygenation (ΔSmO2) exhibited a significant positive correlation with SRR (r = 0.656, p = 0.028), while Reoxygenation Hemoglobin Slope (ROHS) displayed a negative correlation (r = -0.644, p = 0.033), suggesting that oxygen utilization and recovery kinetics differentiate athletes with higher anaerobic or aerobic capacities.
Discussion
These findings highlight the potential of SmO2-derived metrics as accessible, noninvasive alternatives for profiling aerobic–anaerobic balance in middle-distance runners, particularly in situations where SRR measurement is impractical or unavailable. Future research should explore how these markers integrate into training models, their predictive validity across different competition levels, and their application in optimizing individualized athlete development programs.
Conclusion
Integrating noninvasive SmO2 monitoring can be a beneficial addition to training programs for enhancing performance outcomes in middle-distance runners.
1. INTRODUCTION
Middle-distance running is a unique discipline in track and field that relies on a close balance of energy contributions from both aerobic and anaerobic energy systems [1, 2]. This dual energetic demand helps explain why these events are considered the “middle ground” of aerobic and anaerobic abilities, where adaptations to both energy systems can influence performance. These varying energy demands lead to a physiologically diverse group of competitors, with some athletes achieving success through higher aerobic capacity and others through anaerobic power [3, 4]. This diversity means that a one-size-fits-all training approach may not be effective. Profiling helps illuminate an athlete’s strengths and, more importantly, their weaknesses, allowing coaches to individualize training that maintains an athlete’s strengths and improves the areas where they are lacking. This is especially relevant in events like the 800 meters, where some of the world’s best athletes are successful due to higher maximal sprint speed and anaerobic speed reserve, enabling them to respond to late-race surges and pace changes [3]. Identifying these traits can help coaches align training with the specific demands of the event. In addition, profiling has been used to guide targeted training interventions—athletes who excel aerobically but underperform anaerobically can improve performance by training their anaerobic system more directly [5]. Researchers and coaches can categorize an athlete’s abilities using different physiological profiling techniques. A physiological profile refers to the comprehensive characterization of an athlete’s aerobic, anaerobic, and neuromuscular/mechanical capabilities, reflecting their unique bioenergetic and biomechanical strengths and limitations that influence performance [6-8].
Middle-distance runners tend to vary in bioenergetic ability, highlighting the need for accurate profiling of biomarkers that can improve understanding of an athlete’s unique strengths and weaknesses [9]. Traditional profiling metrics, like VO2max and lactate threshold, have been shown to be insufficient in predicting middle-distance race performance and fail to encompass an athlete’s anaerobic abilities [3, 4]. A more recent metric used in middle-distance profiling is the Speed Reserve Ratio (SRR), which addresses the limitations of other metrics by measuring both an athlete’s aerobic and anaerobic capacity. The SRR is calculated as the ratio of an athlete’s maximum sprint speed (MSS) to their maximum aerobic speed (MAS). Higher SRR values indicate greater anaerobic power, while lower SRR values indicate stronger aerobic capacity [10]. By capturing both speed domains of performance, SRR yields a more comprehensive bioenergetic profile [11].
Despite its utility as a profiling metric, obtaining accurate SRR values can be difficult due to the specialized equipment required for testing, such as high-speed treadmills, metabolic carts, and laser timing systems. Practical limitations of accurately measuring SRR have prompted interest in other noninvasive biomarkers that could serve as alternatives. Consequently, newer techniques are being explored because of their portability, relatively low cost, sensitivity to training adaptations, and demonstrated links to middle-distance performance [12-20].
Muscle oxygen saturation (SmO2), which refers to the balance between oxygen delivery and utilization within skeletal muscle and is commonly assessed noninvasively using near-infrared spectroscopy (NIRS), is one alternative metric used to profile athletes. Several SmO2-derived metrics have correlated with athletic performance outcomes in both sprint and endurance athletes. These metrics include SmO2 delta (ΔSmO2), muscle deoxygenation slope (MdO2 slope), reoxygenation slope (ROHS), and the inflection point (IP). ΔSmO2 is calculated as the percent change from baseline to minimum SmO2 during exercise, reflecting local oxygen extraction and oxidative efficiency [16]. MdO2 slope represents the initial rate of desaturation during the onset of exercise, indicating the speed of aerobic engagement [17]. IP is the breakpoint in the SmO2 curve during exercise, corresponding to systemic lactate threshold and the shift toward anaerobic metabolism [18]. ROHS is the rate of SmO2 recovery post-exercise, assessing the muscle’s capacity for oxygen restoration [19]. Although these SmO2 metrics have proven useful in athletics, their ability to profile and distinguish physiological subgroups in middle-distance runners remains unexplored.
Peak post-exercise blood lactate concentration ([La]bmax), defined as the highest blood lactate value measured after exercise, has also been associated with both middle-distance performance and an athlete’s anaerobic capacity [20, 21]. Athletes with higher [La]bmax values tend to demonstrate greater anaerobic power and sprint performance, while lower values may indicate improved lactate clearance and more efficient aerobic metabolism [14]. This balance between lactate production and clearance is relevant in middle-distance performance, where both anaerobic and aerobic systems are significantly taxed. However, despite the utility of [La]bmax in identifying general metabolic capabilities, its interpretability is constrained by physiological and methodological factors [22, 23]. In addition, the correlational strength between [La]bmax and SRR has yet to be examined.
Given these considerations, this study aims to determine whether SmO2-derived metrics and/or [La]bmax can serve as practical, noninvasive alternatives to SRR for profiling the aerobic–anaerobic balance in NCAA Division I middle-distance runners. We hypothesized that SmO2-derived metrics, including the percent change in muscle oxygenation (ΔSmO2), the muscle deoxygenation slope (MdO2 slope), the inflection point (IP), and the reoxygenation slope (ROHS), would significantly correlate with SRR, offering insight into an athlete’s balance of aerobic and anaerobic capabilities. Specifically, we expected that higher ΔSmO2 values and steeper MdO2 slopes would be associated with lower SRR values, reflecting greater aerobic efficiency. We also hypothesized that a higher IP would occur in athletes with lower SRR values, indicating the ability to sustain higher workloads before shifting toward anaerobic metabolism. Additionally, we predicted that a steeper ROHS would correlate with lower SRR values, signifying more efficient oxygen recovery following maximal exercise. Finally, we expected that elevated [La]bmax would correlate with higher SRR values, reinforcing its role as an indicator of anaerobic power.
2. METHODOLOGY
2.1. Study Design
This cross-sectional study examined relationships among SmO2 metrics, [La]bmax, and SRR in NCAA Division I middle-distance runners. All testing took place at the Movement Science Lab and Jack Rose Track at CSULB. To minimize fatigue and ensure data quality, testing was divided into three separate days, with a minimum of 48 hours of recovery provided between sessions. Day 1 included baseline anthropometrics and a familiarization trial. Day 2 assessed MSS via sprint tests on the outdoor track. Day 3 consisted of an incremental treadmill protocol to determine MAS and record SmO2 via NIRS, with post-test blood samples collected for [La]bmax. Distributing assessments in this manner reduced carry-over fatigue and ensured maximal effort in both anaerobic and aerobic tests. Ethical clearance was granted by the Institutional Review Board (IRB) of CSU Long Beach, ensuring adherence to ethical standards in research involving human subjects.
2.2. Procedures
All testing procedures were performed under controlled conditions, with standardized warm-ups and cooldowns implemented to maintain participant consistency.
2.2.1. Day 1: Anthropometric Assessments and Familiarization Trial
The first session focused on baseline measurements and participant familiarization with the experimental protocol. Upon arrival, height and body mass were recorded using a calibrated Health O Meter 500KL stadiometer and digital scale. Body composition was assessed via seven-site skinfolds (triceps, subscapular, chest, midaxillary, suprailiac, abdomen, thigh), with measurements taken using a Lange skinfold caliper and calculated using the Jackson and Pollock equation [24]. A single investigator performed all body composition assessments to minimize measurement variability. For the familiarization test, participants completed a self-paced three-mile treadmill run while wearing a reusable face mask (COSMED, Rome, Italy). The Train.RED FYER NIRS device (Train.Red, Elst, Netherlands) was affixed to the vastus lateralis muscle to assess SmO2. This familiarization session aimed to minimize learning effects in subsequent trials and ensure participants could perform at maximal effort without interference from unfamiliar equipment. Due to equipment constraints, six of the 11 participants completed their trials on a Cybex 751T treadmill, and the remaining five used a Woodway ELG treadmill. Although both models are widely used in exercise testing, minor differences in belt speed calibration, shock absorption, and surface characteristics may introduce variability.
2.2.2. Day 2: Maximum Sprint Speed Testing
The second session focused on testing for MSS on the Jack Rose synthetic track at California State University, Long Beach. Participants completed a standardized warm-up routine, which included five minutes of low-intensity jogging, dynamic stretching, and strides. Each participant then performed three 50-meter sprints on a flat synthetic track, with at least three minutes of passive recovery between attempts to mitigate fatigue. A 50 m all-out sprint was used to capture maximal sprint speed, as this distance reliably elicits near-maximum velocity in athletic populations [25]. Sprint velocity was measured using a Brower TCI Timing System, with laser timing gates positioned at 40 meters and 50 meters to capture peak speed. The highest recorded velocity across the three trials was designated as the participant’s MSS.
2.2.3. Day 3: Max Aerobic Speed Testing
The final session consisted of an incremental treadmill test designed to assess MAS, SmO2, and [La]bmax. Before testing, participants were fitted with a Polar H10 heart rate monitor, a COSMED face mask connected to a metabolic analyzer (COSMED, Rome, Italy), and the NIRS optode secured to the vastus lateralis muscle with adhesive patches and an elastic bandage. Baseline SmO2 values were then recorded while participants remained seated for five minutes, providing a resting reference point [25].
Participants then completed a standardized ten-minute warm-up, beginning with five minutes of running at 14 km/h, followed by dynamic stretching. The treadmill test protocol commenced at 14 km/h, increasing by 1 km/h every minute until 19 km/h. Beyond this point, increments decreased to 0.5 km/h per minute until 21 km/h, and then to 0.2 km/h per minute until voluntary exhaustion [12]. SmO2 was continuously monitored to assess oxygen extraction and utilization in working muscle tissue.
Post-exercise blood lactate concentration in millimoles per liter (mmol/L) was measured to assess anaerobic energy system engagement. Blood samples were collected from the earlobe at one, three, five, and seven minutes following the treadmill test using a Lactate Scout 2 analyzer (EKF Diagnostics) [12, 26]. The highest value recorded during this period was designated as [La]bmax, representing peak lactate accumulation in response to exercise. The timing of lactate sampling was intended to ensure that peak concentrations were captured within the expected post-exercise window [26]. Although post-exercise blood lactate was sampled at multiple time points, actual individual peak values may occur outside this window [22]. This methodological limitation should be considered when interpreting [La]bmax.
SmO2 phases during incremental treadmill testing.
2.3. SRR
SRR was used to classify athletes based on their aerobic and anaerobic physiological attributes. It was calculated as the ratio of MSS to MAS, determined using the formula [10]:
SRR = MSS/MAS
MSS was obtained from the fastest 50-meter sprint trial recorded with laser timing gates. MAS was identified as the velocity at VO2max (vVO2max) during the treadmill test, based on breath-by-breath metabolic gas exchange analysis. The lowest treadmill speed at which VO2max was maintained was designated as vVO2max, following established methodology [6].
2.4. NIRS and SMO2 Metrics
SmO2 was continuously monitored using a Train.RED FYER NIRS device placed over the vastus lateralis. This non-invasive optical method calculates relative changes in total hemoglobin (tHb) by detecting the interplay between oxygenated and deoxygenated hemoglobin, using wavelengths at 760 nm (deoxyhemoglobin) and 850 nm (oxyhemoglobin). SmO2 data were recorded at 10 Hz, consistent with the sampling rates reported in validation studies of wearable NIRS devices. Calibration was automatically done through the Train.RED app automatically during a one-minute initialization phase, as recommended by the manufacturer. Prior research has validated the reliability of the Train.RED FYER system for tracking hemoglobin saturation changes in sports science contexts [27]. To examine the muscle’s oxygenation response during the incremental treadmill test, SmO2 data were divided into four distinct phases (Fig. 1):
(1) Baseline – A five-minute seated rest period before the warm-up, establishing the individual’s resting SmO2 [25].
(2) Test – The entire duration of the treadmill protocol from onset to volitional exhaustion.
(3) End-of-Test – The final 30 seconds before the subject terminated the test, representing peak physiological strain [28].
(4) Recovery – The first minute immediately following exercise cessation, capturing initial reoxygenation patterns.
From these phases, four key SmO2-derived metrics were calculated. ΔSmO2 quantifies the magnitude of deoxygenation after an exercise bout by expressing the percent difference between baseline and End-of-Test SmO2 values; calculated as the percent between these two values [16, 29]:  . MdO2 slope reflects the rate of SmO2 decline at exercise onset and was obtained by fitting a segmented regression to the Test phase and extracting the linear slope up to the second major inflection point in the SmO2–time curve, isolating the primary deoxygenation phase before plateau (Fig. 2). Several studies have shown that muscle deoxygenation often exhibits more than one breakpoint, reflecting different stages of oxygen extraction and metabolic demand during incremental exercise. By focusing on the interval between the start of exercise and this second inflection, we capture the linear portion of deoxygenation that best represents the upper limit of oxygen extraction before a subsequent plateau or slower rate of change [17, 30, 31]. For the IP metric, we chose the first major breakpoint in the SmO2 curve, identified via the same segmented regression analysis used for the MdO2 slope (Fig. 3). The inflection marks the transition from predominantly aerobic to increasing anaerobic metabolism and corresponds closely with systemic lactate thresholds (VT1/LT1), indicating when oxygen supply begins to lag behind demand [18]. Finally, the ROHS is defined as the linear rate of SmO2 increase during the Recovery phase, with steeper slopes reflecting faster muscle reoxygenation driven by local perfusion and mitochondrial function (Fig. 4) [19].
MdO2 slope segmented regression analysis.
Determination of IP using segmented regression analysis.
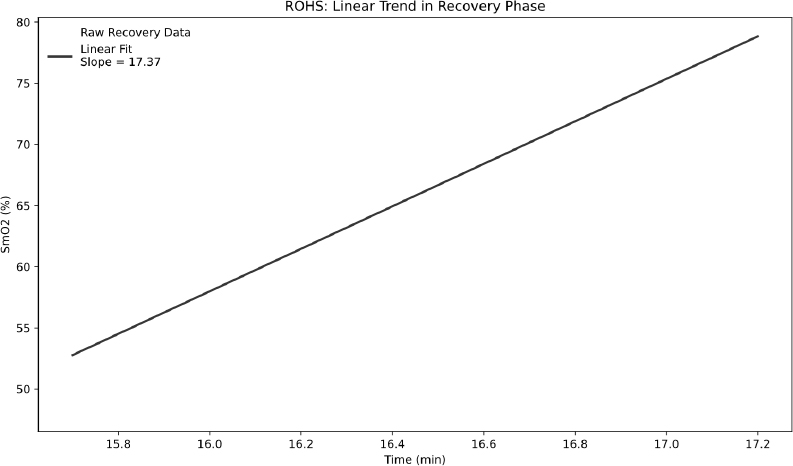
Determination of ROHS post-maximal exercise.
2.5. Data Analysis
Statistical analyses were carried out in SPSS 26 (IBM, Armonk, USA) and R Studio 4.2.1 (R Core Team, Vienna, Austria). Variables were described using means ± SD, medians, ranges, and kurtosis, and distribution normality was assessed using the Shapiro–Wilk test. To explore relationships among SmO2 metrics, [La]bmax, and SRR, Pearson correlation coefficients were calculated and 95% confidence intervals were reported for each estimate. The alpha level was set a priori at <0.05. Data trends and the strength of linear associations were visualized with scatterplots and segmented‐regression charts. SmO2 kinetics were examined by identifying key inflection points and computing deoxygenation and reoxygenation slopes. All procedures adhered to standard practices in sports science research. All figures were generated using Python (Matplotlib library).
3. RESULTS
3.1. Descriptive Statistics
A total of 11 NCAA Division I middle-distance runners participated in this study. The average age of participants was 20.36 ± 1.57 years, with an average height of 178.12 ± 7.08 cm, and an average weight of 65.51 ± 6.62 kg. The body fat percentage averaged 7.56 ± 1.78%, and the average weekly mileage reported was 48.18 ± 18.34 miles. Table 1 presents the descriptive statistics of key performance and physiological variables (MSS, MAS, SRR, VO2max, [La]bmax, ΔSmO2, MdO2, ROHS, and IP). The mean (±SD) VO2max was 68.09 ± 4.90 ml/kg/min, and the average SRR was 1.48 ± 0.16, with values ranging from 1.34 to 1.73.
| - | N | Minimum | Maximum | Mean | Std. Error | Std. Deviation | Kurtosis |
|---|---|---|---|---|---|---|---|
| MSS | 11 | 28.20 | 35.30 | 30.60 | 0.62 | 2.04 | 1.68 |
| MAS | 11 | 18.10 | 21.85 | 20.59 | 0.36 | 1.19 | 0.46 |
| SRR | 11 | 1.34 | 1.73 | 1.48 | 0.05 | 0.16 | -0.93 |
| VO2max | 11 | 60.23 | 75.60 | 68.09 | 1.48 | 4.90 | -0.87 |
| [La]bmax | 11 | 6.10 | 19.60 | 11.76 | 1.35 | 4.46 | -1.01 |
| ΔSmO2 | 11 | 27.23 | 52.89 | 34.19 | 2.15 | 7.13 | 4.83 |
| MdO2 | 11 | -11.84 | 3.10 | -4.59 | 1.29 | 4.27 | -0.14 |
| ROHS | 11 | 43.20 | 78.45 | 62.99 | 3.44 | 11.42 | -0.88 |
| IP | 11 | 6.12 | 8.67 | 7.66 | 0.23 | 0.77 | 0.05 |
Note: N = 11. MSS, maximal sprint speed (m/s); MAS, maximal aerobic speed (km/h); SRR, speed reserve ratio (MSS divided by MAS); VO2max, maximal oxygen uptake (ml·kg−1·min−1); [La]bmax, peak blood lactate concentration (mmol/L); ΔSmO2, percent change in muscle oxygen saturation from baseline to end of test; MdO2, muscle deoxygenation slope; ROHS, rate of muscle reoxygenation following exercise; IP, inflection point of SmO2 curve during incremental exercise. Notably, [La]bmax ranged from 6.1 to 19.6 mmol·L−1, whereas SRR ranged only from 1.34 to 1.73, which may have reduced the power of correlations.
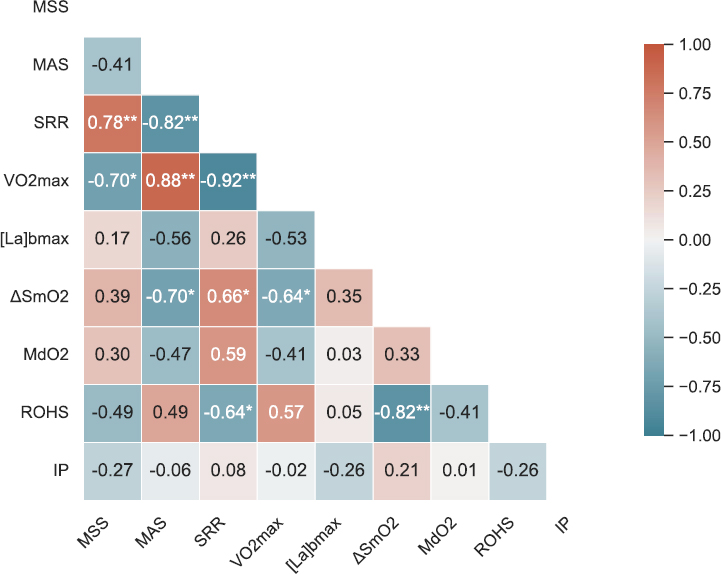
Note: Warmer colors represent positive correlations and cooler colors represent negative correlations. Asterisks indicate statistical significance (*p < 0.05, **p < 0.01).
3.2. Correlation Heat Map
(Fig. 5) presents a Pearson correlation heat map summarizing the relationships among key physiological and performance metrics (MSS, MAS, SRR, VO2max, [La]bmax, ΔSmO2, MdO2, ROHS, and IP). Notably, SRR displayed a moderate positive correlation with ΔSmO2 (r = 0.66, p = 0.028) and a moderate negative correlation with ROHS (r = -0.64, p = 0.034). In contrast, [La]bmax did not show a statistically significant relationship with SRR (r = 0.25, p = 0.457).
3.3. Relationships Between SRR and Physiological Markers
As illustrated in Fig. (6A), ΔSmO2 demonstrated a significant positive correlation with SRR (r = 0.66, p = 0.028). Athletes with higher SRR (i.e., relatively more anaerobic-inclined) tended to show a larger percent change in muscle deoxygenation, whereas lower-SRR (more aerobic) runners exhibited smaller ΔSmO2 values. Fig. (6B) shows the inverse relationship between ROHS and SRR (r = -0.64, p = 0.034). Participants with lower SRR (suggesting stronger aerobic capacity) displayed faster reoxygenation rates, whereas higher-SRR individuals recovered more slowly post-exercise. Fig. (6C) shows the correlation between SRR, with the data points widely scattered, indicating substantial inter-individual variability. Although [La]bmax spanned a wide range across participants (6.1–19.6 mmol/L), no significant correlation emerged with SRR (r = 0.25, p = 0.457).
4. DISCUSSION
This study aimed to determine whether SmO2-derived metrics and/or [La]bmax could serve as practical, noninvasive alternatives to the speed reserve ratio (SRR) for profiling the aerobic–anaerobic balance in NCAA Division I middle-distance runners. Of the SmO2 metrics examined, only ΔSmO2 and ROHS significantly correlated with SRR. Contrary to our hypothesis, ΔSmO2 correlated positively with SRR (r = 0.656, p = 0.028), while ROHS supported our hypothesis with a negative correlation (r = –0.644, p = 0.033). These findings reveal a complex relationship between local oxygen utilization patterns and physiological profiles. IP, MdO2 slope, and [La]bmax did not show significant correlations with SRR or with each other.
(A-C) Correlation scatter plots.
Note: Scatter plots showing the relationships between speed reserve ratio (SRR) and key physiological variables. Panel A displays the correlation between SRR and percent change in muscle oxygen saturation (ΔSmO2); Panel B shows SRR versus the reoxygenation slope (ROHS); and Panel C presents SRR versus peak blood lactate concentration ([La]bmax). Each point represents an individual participant (N = 11), and dashed lines indicate the line of best fit.
One of the key findings was the unanticipated positive correlation between ΔSmO2 and SRR. A higher SRR indicates greater anaerobic capacity, characterized by a high maximal sprint speed relative to aerobic capacity. In contrast, a lower SRR reflects stronger aerobic capacity and endurance-oriented physiology. We expected that runners with lower SRR would exhibit larger ΔSmO2 due to their skeletal muscles’ enhanced ability to extract and utilize oxygen [32-34]. Instead, runners with higher SRR showed the greatest muscle deoxygenation during the maximal exercise. This pattern mirrors earlier research on sprint athletes performing 30-second Wingate tests under simulated hypoxia [16]. A plausible explanation for this observation involves differences in muscle fiber composition and capillary structure between anaerobic and aerobic athletes. Athletes with higher anaerobic capacity (higher SRR) typically have more fast-twitch (Type II) fibers, characterized by lower capillary density and mitochondrial content compared to slow-twitch (Type I) fibers. During intense exercise, Type II fibers rapidly utilize oxygen, potentially exceeding the rate at which oxygen can be delivered to the sarcolemma through local microvasculature. This mismatch leads to pronounced muscle deoxygenation at the onset of exercise and may persist under conditions of maximal exertion due to ongoing oxygen supply-demand imbalance [27, 35]. By contrast, endurance training stimulates angiogenesis and enhances microvascular function in the skeletal muscle, supporting sustained oxygen delivery and blunting the SmO2 drop during exercise [36-39]. Together, these physiological differences suggest that ΔSmO2 reflects underlying muscle fiber composition and vascular characteristics, which may help explain its positive association with SRR by distinguishing athletes with more anaerobic versus aerobic physiological profiles.
We observed a strong negative correlation between ROHS and SRR (r = –0.644, p = 0.033), supporting our initial hypothesis that athletes with lower SRR recover muscle oxygenation more rapidly following a maximal exercise bout. Such rapid SmO2 recovery likely reflects multiple endurance-related adaptations. As stated before, endurance training increases both capillary and mitochondrial density in skeletal muscle, which has been shown to significantly improve oxygen delivery and utilization during exercise and recovery periods [38, 39]. In addition, aerobic athletes tend to have increased myoglobin content, which can enhance intracellular oxygen diffusion, facilitating a faster return of SmO2 level after exercise [40]. These adaptations could underpin the steeper ROHS slopes seen in the athletes with lower.
This study did not find any significant correlation with [La]bmax SRR or any SmO2 metric, indicating that this metric alone cannot distinguish aerobic-anaerobic profiles in middle-distance runners. Although higher lactate levels reflect increased glycolytic activity during exercise, their absolute value and timing of reaching peak levels are influenced by individual factors, including buffering capacity, blood volume shifts, and training status [13]. Additionally, variability in lactate clearance rates can cause true peak lactate to occur outside the standard 3-to-7-minute postexercise sampling window used in this study [41, 42]. It is also possible that, within a homogenous cohort of well-trained middle-distance athletes, physiological profiles are so similar that [La]bmax lacks the sensitivity to detect subtle interindividual differences. While lactate testing remains a useful tool for understanding metabolic stress during exercise, its ability to fully profile middle-distance runners may be limited.
In addition, IP and MdO2 slope did not significantly correlate with the SRR or the other metrics. Threshold metrics from NIRS measurements can vary considerably due to factors such as sensor placement, treadmill protocol, and individual variability in metabolic transitions, limiting their reliability [43, 44]. Minor variations in the NIRS optode placement or changes in treadmill grade can substantially alter detected thresholds, highlighting the challenges of using these metrics to accurately profile aerobic–anaerobic balance in athletes.
Overall, these findings indicate that ΔSmO2 and ROHS seem to be valid alternatives to the SRR and provide valuable insights into an athlete’s physiology. These metrics may be incorporated into an athletic training program in order to understand an athlete’s strengths and weaknesses, how they respond to training, and the race strategy that might suit them best. Systematic tracking of these metrics across training cycles may help coaches make adjustments in an athlete's exercise choice, intensity, and rest intervals in order to improve race performance while reducing the risk of overtraining.
Despite these promising insights, several limitations of our study must be acknowledged. First, the use of two different treadmill models (Cybex 751T and Woodway ELG) introduced potential variability in belt calibration, cushioning, and running surface characteristics, possibly influencing results despite standardization efforts. Second, our relatively small sample size (n=11) comprised only males, which restricts the generalizability of these findings to broader populations of middle-distance runners. Future research should include larger and more diverse cohorts, incorporating both male and female athletes across varying competitive levels, to enhance statistical power and clarify whether SmO2 and [La]bmax responses differ significantly between subgroups. Third, high variability was found in multiple of the metrics, such as the MdO2 and IP metrics. This raises concerns about reliability that should be considered when interpreting these measures. Fourth, fixed lactate sampling intervals (1-, 3-, 5-, and 7-minute post-exercise) might not have captured the true peak lactate concentration in all athletes due to individual differences in lactate response and clearance rates. Future studies should consider either continuous lactate monitoring or increasing the sampling intervals. Fifth, the absence of direct on-track performance data limits the practical application of the metrics. Future research should integrate these metrics with actual competition performance data to improve the predictive validity. Finally, the cross-sectional design of this study provides only a snapshot of athlete physiology and does not assess how interventions targeting ΔSmO2 or ROHS affect performance over time. Prospective, intervention-based studies that manipulate training variables based on SmO2 feedback could yield valuable insights into optimal training strategies tailored to individual aerobic and anaerobic profiles.
CONCLUSION
This study investigated whether SRR, SmO2 metrics, and [La]bmax could collectively inform the aerobic–anaerobic profiles of NCAA Division I middle-distance runners. Our findings indicate that SRR is a valuable composite measure reflecting an athlete’s balance between sprinting and endurance capacities, with ΔSmO2 positively correlating and ROHS negatively correlating with SRR. These correlations highlight the utility of portable NIRS technology for distinguishing athletes who rely heavily on anaerobic power (higher SRR, greater ΔSmO2) from those who are better adapted aerobically (lower SRR, steeper ROHS). Conversely, [La]bmax alone did not significantly correlate with SRR or other physiological metrics.
Practically, coaches can leverage SmO2 metrics during training to individualize workout intensities, optimize recovery intervals, and monitor physiological responses. Regular tracking of ΔSmO2 and ROHS can assist in identifying appropriate training interventions, detecting early signs of fatigue, and preventing overtraining. Given the limitations associated with the small sample size and the absence of direct competition performance data, future research should seek to validate these findings in larger, more diverse athlete cohorts and explore longitudinal relationships between NIRS-derived metrics and actual race outcomes. Overall, this study supports integrating noninvasive SmO2 monitoring into training programs to enhance athlete-specific training strategies and performance outcomes in middle-distance runners.
AUTHORS’ CONTRIBUTIONS
The authors confirm their contribution to the paper as follows: J.A.C.: Study conception and design; B.K., A.K.: Data collection; E.E.S., K.A.E.: Analysis and interpretation of results; K.A.V.: Writing - reviewing and editing. All authors reviewed the results and approved the final version of the manuscript.
LIST OF ABBREVIATIONS
| SRR | = Speed Reserve Ratio |
| SmO2 | = Skeletal Muscle Oxygenation |
| [La]bmax | = Blood Lactate Concentration |
| ΔSmO2 | = Change in Skeletal Muscle Oxygenation |
| ROHS | = Reoxygenation Hemoglobin Slope |
| MSS | = Maximum Sprint Speed |
| MAS | = Maximum Aerobic Speed |
| NIRS | = Near-infrared Spectroscopy |
| MdO2 | = Muscle Deoxygenation |
| IP | = Inflection Point |
| tHb | = Total Hemoglobin |
ETHICS APPROVAL AND CONSENT TO PARTICIPATE
The project was approved by the California State University, Long Beach Institutional Review Board, USA for project number 1887311-4.
HUMAN AND ANIMAL RIGHTS
All procedures performed in studies involving human participants were in accordance with the ethical standards of institutional and/or research committee and with the 1975 Declaration of Helsinki, as revised in 2013.
CONSENT FOR PUBLICATION
Informed consent was obtained from all subjects who participated in the research.
AVAILABILITY OF DATA AND MATERIALS
The data and supportive information are available within the article.
CONFLICT OF INTEREST
Dr. Valenzuela Kevin A., is the Editorial Advisory Board member of The Open Sports Sciences Journal.
ACKNOWLEDGEMENTS
The authors would like to extend their sincere gratitude to the California State University, Long Beach Track and Field team for their invaluable support and participation during data collection. Their cooperation and dedication were instrumental in making this study possible.
DISCLOSURE
Part of this article has been previously published in the International Journal of Exercise Science Conference Proceedings as an abstract submitted to the Southwest American College of Sports Medicine Annual Conference (International Journal of Exercise Science Conference Proceedings: Vol. 14: Iss. 3, Article 92, November 2023).