All published articles of this journal are available on ScienceDirect.

Aerobic Capacity Differences among Elite and Sub-elite Young Female Soccer Players: A Longitudinal Comparison by Competition Level and Playing Position
Authors Info & Affiliations
Abstract
Introduction
The study investigated the aerobic capacity differences of female soccer players according to performance level and playing position and explored longitudinal trends among elite players over two decades.
Methods
Female soccer players (N = 68, age = 23.33 ± 3.55 years, weight = 58.91 ± 7.70 kg, height = 164.03 ± 6.20 cm) were assessed for maximal oxygen uptake (V̇O2max), velocity at V̇O2max (vV̇O2max), heart rate (HR), anaerobic threshold (AT), and velocity at AT (vAT). Data for the same aerobic indicators from both former 2004 Olympic Team members and current National Team players were used to examine changes over time.
Results
One-way ANOVA revealed significant differences in aerobic performance across performance levels, but not between playing positions. A decline in aerobic capacity indicators was observed over the 20 years among elite players.
Discussion
These findings challenge the assumption that higher competition level equates to superior aerobic fitness and underscore the role of tailored training programs. They highlight the importance of individualized conditioning strategies aligned with players’ specific needs, regardless of their competitive tier. The apparent absence of significant positional differences may also reflect a lack of specialized endurance training across different field roles.
Conclusion
The results emphasize the need for ongoing physiological monitoring to support long-term player development, ensure optimal training loads, and guide evidence-based decision-making for coaches and practitioners. The inclusion of longitudinal data enables a better understanding of trends in aerobic capacity over time and informs future conditioning strategies in elite women’s soccer.
1. INTRODUCTION
Female soccer is a rapidly evolving, physically demanding sport [1]. In recent years, a plethora of studies have investigated female players’ physiological characteristics, as these play an important role in soccer performance [2-7]. Researchers report that the players’ physical capacity, which varies even among well-trained players, distinguishes match performance capabilities in elite female soccer players [1, 7].
In parallel with this growing body of research, the evolution of sports science and modern coaching methodologies has significantly enhanced the effectiveness of soccer-specific conditioning. From a coaching science perspective, key training principles such as specificity, progression, and individualization are central to the preparation of elite athletes. Monitoring aerobic capacity and related markers such as V̇O2max and anaerobic threshold enables practitioners to detect training-induced changes, assess the efficacy of periodization cycles, and individualize loads based on competitive level or positional demands. The systematic assessment of these indicators offers not only a snapshot of an athlete’s current fitness status but also a roadmap for training prescription and long-term development.
Technological innovations have further strengthened the applied nature of training interventions in female soccer. Tools such as laboratory gas analyzers, wearable GPS systems, and integrated metabolic sensors allow the objective quantification of internal and external loads. These advances have facilitated the translation of physiological data into real-time feedback for training adjustments, enabling the fine-tuning of endurance conditioning protocols to mirror match demands more closely. Despite these innovations, there is a scarcity of longitudinal studies that track aerobic capacity trends over time in elite female players.
Most of the activities in a soccer game are of low to moderate intensity, predominantly requiring the aerobic metabolic system [1, 7]. A recent analysis of female soccer games reported that players perform a large number of maximal or near-maximal short-duration sprints with brief recovery periods in between, during the 90-minute match. For the recovery in between these high-intensity periods, aerobic metabolism is enabled [8]. Therefore, the examination and understanding of aerobic metabolism and its contribution to the game’s demands in female soccer is required [9].
Previous studies on female soccer have indicated that a player’s aerobic capacity is competition-level dependent [7, 10]. Researchers have reported V̇O2max values of elite female players between 47 and 57 mL · kg–1min–1 [3-7, 11-14], while lower values of V̇O2max were reported for lower performance level players (second and lower divisions) [6, 11, 15, 16]. Studies have examined the aerobic capacity of female soccer players and compared data from young and senior national team players [2, 6], first and second division players [6, 11], and national and first division players [6, 11]. However, no study to our knowledge has compared data from the highest to the lowest competitive level.
Only a few researchers so far have examined positional differences in V̇O2max performance in elite or sub-elite female soccer players [6, 7, 11, 15, 17, 18]. Data from older studies indicated significant differences in players’ V̇O2max performance according to players’ position, with midfielders performing better [1, 10, 19-21]. Match analyses using GPS and tracking systems have shown that players perform substantial high-speed running and repeated sprint efforts during games, particularly in elite competitions [22, 23]. While earlier studies suggested midfielders display superior aerobic capacity due to their central role in gameplay [10, 19], recent research shows that position-specific match running performance varies significantly, with high-intensity distances and workloads differing across positions [22, 24]. However, laboratory measures such as VO2max do not always reflect these on-field differences [4, 7, 11].
Scientific studies concerning the physiological characteristics of female soccer players and the game’s demands have multiplied over the years [9]. Nevertheless, limited research data are reported for female players’ V̇O2max performance evolution through the years. Moreover, longitudinal studies indicate that aerobic fitness can fluctuate within, influenced by training load, recovery management, and match intensity [25, 26]. Parpa et al. [25] demonstrated season-long variations in VO2max linked to training and recovery in elite female players, while Papaevangelou et al. [27] reported similar trends. The importance of such data is profound, as it could indicate to training experts the effectiveness of training methods used over time in female soccer.
To our knowledge, no study has yet compared aerobic capacity across the entire competitive spectrum—from elite international players to lower-division athletes—using consistent protocols. Only one study, to our knowledge, has critically examined the long-term trend in VO2max performance through direct comparison of former and current elite female players.This literature gap highlights the need for longitudinal and cross-sectional investigations that integrate both laboratory-based and match-derived performance indicators.
The primary aim of this study was to investigate the aerobic capacity characteristics of female soccer players and to identify the influence of these factors on players’ performance, comparing data of female soccer players of different performance levels (from elite level to lower performance levels) and with varying positions of playing in the field.
A secondary aim of the study was to explore differences in V̇O2max indicators between former active and recent active elite female soccer players, comparing data from former elite players (players who participated in the Olympic Games (Olympic Team) and from the current National Team (NT), and to identify any changes over time.
We hypothesized that higher-performance-level female soccer players would have significantly better V̇O2max indicators. We also hypothesized that midfield players would perform better than all other positional role players in the game. Finally, we hypothesized that current NT players would have better V̇O2max performance than former NT players.
2. MATERIALS AND METHODS
2.1. Experimental Approach
In the present experimental study, we investigated the V̇O2max indicators of different playing level players (elite level: players of the national team and first division, sub-elite: players of the second division, and lower level: players of the third division, the lowest division) and different playing position players (goalkeepers, defenders, midfielders and attackers) in ten years (2015-2025).
We also investigated trends over time in the aerobic capacity of elite female soccer players: we compared data of the current national team players and data (unpublished) of former elite national team players who participated in the Olympic Games of 2004 (Olympic Team). V̇O2max values, cardiorespiratory indicators, age, height, weight, and training experience were measured for all study participants.
2.2. Subjects
In the early stages of the study design, a power analysis was conducted to calculate the smallest sample size needed for the study. An effect size of >0.50, a probability error of 0.05, and a power of 0.95 for the four groups was set. The analysis indicated that a minimum of 61 subjects was the acceptable number of participants for the study to explore interactions between the four groups.
In the present study, data were collected from sixty-eight (n=68) Greek female soccer players of different performance levels over two years. More specifically, data were collected from ten players (n=10) on the current national team (and first division players), nineteen (n=19) from the first division (but not on the national team), seventeen (n=17) from the second, and twenty-two (n=22) from the third division. All players in the study were active players participating in their team’s training and matches in the competitive season, with no injury problems in the last six months. For the study, unpublished data from eleven players (n=11) of the Greek Women’s National Team who participated in the 2004 Olympic Games (Olympic Team) were used for comparisons.
Some of the players performed more than one assessment, but only one of the assessments was considered for the project. The player’s anthropometric data were age (age = 23.33 ± 3.55 years, weight = 58.91 ± 7.70 kg, height = 164.03 ± 6.20 cm). Of the players, six (n=6) were goalkeepers (GK), thirty (n=30) defenders (DEF), twenty-three (n=23) midfielders (MIDF), and eighteen (n=18) attackers (ATT). Two players did not report their position on the field.
All testing procedures were explained to participants before the start of the study. Written informed consent was signed by all participants before any testing procedure.
The study was approved by our university’s Institutional Review Board (approval number 28/2022) and was conducted according to the Declaration of Helsinki.
2.3. Procedures
2.3.1. Anthropometric Measurements
Body weight was measured to the nearest 0.1 kg using an electronic digital scale (Seca 220e, Gmbh & Co, Hamburg, Germany). Height was measured to the nearest 0.5 cm.
2.3.2. Maximal Oxygen Consumption V̇O2max Assessment
All female athletes were active players on first, second, or third division teams, who participated in the national championships. They were all assessed at the Laboratory of Evaluation of Human Biological Performance of the Department of Physical Education and Sport Science of the Aristotle University of Thessaloniki. All players visited the laboratory in the morning. They were instructed to abstain from any practice session 48 hours before the measurement and all players were free from injury. On their first visit to the laboratory, they all completed a consent form, and body weight and height were measured.
All athletes performed a 10-minute warm-up on a stationary standardized graded cycle ergometer (Monark 839E, Monark Exercise AB, Sweden) at 50-60 RPM and a short stretching session for the working muscles before the V̇O2max assessment. Completing the warm-up, the players performed a maximal exercise test on a treadmill, using a continuous exercise testing protocol. The protocol consisted of three initial three-minute stages at the speeds of 8, 10, and 12 km.h-1 and continued with 1 km h–1 min–1 increase stages in running velocity, until exhaustion. The test was terminated if athletes met three of the following criteria: a) V̇O2 values leveled off despite increasing workload, b) heart rate (HR) during the last minute exceeded 95% of the expected maximal HR predicted (220- age), c) a respiratory gas exchange ratio (V̇CO2/ V̇O2) at or higher than 1.1 was reached [28], and d) athletes were unable to continue their effort despite motivation.
The V̇O2max test was performed on a motorized treadmill (pulsar; h/p/Cosmos, Nussdorf-Traunstein, Germany).
V̇O2max values and cardiorespiratory indicators were measured via a breath-by-breath automated pulmonary-metabolic gas exchange system (Oxycon Pro; Jaeger, Wurzburg, Germany). HR, V̇O2max in L· min–1 and V̇O2max in ml· min–1· kg–1, speed at V̇O2max (vV̇O2max), Anaerobic Threshold (AT), and speed at Anaerobic Threshold (vAT), were assessed in all players. HR was recorded with a Polar H1 monitor during the entire protocol (Polar, Kempele, Finland).
All data on the 2004 Olympic Team (OT) were collected from 2002 to 2004 in the Exercise Physiology Laboratories of the Departments of Physical Education and Sport Science of the Aristotle University of Thessaloniki and of the Democritus University of Thrace and were matched with the data collected for the present study. All players of the 2004 OT underwent the same testing procedures as current players, and all the data from the Olympic Team were collected using the same testing protocol, equipment brands (e.g., Jaeger Oxycon Pro, h/p/Cosmos treadmill), and laboratory environment as in the current study. Additionally, the test administrators were faculty members from the same academic departments, ensuring procedural uniformity.
2.4. Statistical Analysis
All statistical analysis was conducted using IBM SPSS Statistics (Version 27). The results and descriptive statistics are reported as mean ±SD. The Kolmogorov-Smirnov test for normality of data distribution was conducted. Differences between OT and NT were evaluated using the Independent Samples T-test. One-way analysis of variance (ANOVA, followed by Scheffe post hoc test, where necessary) was performed to identify performance differences among players of different divisions and different playing positions (goalkeepers, defenders, midfielders, attackers), effect size was calculated (η2). For each player, only one result was considered for each analysis (her best result). All playing positions were identified for each player by her statement. The statistical significance level was set at p <0.05.
3. RESULTS
The Kolmogorov-Smirnov test for the normality of the data distribution was conducted, and all variables were normally distributed (p > 0.05).
3.1. V̇O2max
Significant differences were found in V̇O2max between players of different divisions (F=4.36, p < 0.05). The post hoc test (Scheffe) indicated that second division players had statistically significant differences (lower performance) only from first division players. There were no statistically significant differences between all other division players. Also, no statistically significant differences in V̇O2max were found between players with different playing positions in the game and between players with varying ages of training (Table 1 & Figs. (1, 2)).
| Division | N=67 | Mean of VO2max/kg (kg-1.min-1) | vV̇O2max (km/h) | vAT (km/h) | Age (y) | Height (cm) | Weight (kg) |
|---|---|---|---|---|---|---|---|
| NT | 10 | 53.66±4.42 | 13.40±0.96 b | 10.60±1.64 | 22.30±1.63 | 166.90±5.48 | 58.70±5.29 |
| 1rst | 19 | 54.17±4.35 a | 13.15±1.25 a | 10.94±1.68 | 24.57±3.67 | 162.84±6.90 | 54.78±5.17 |
| 2nd | 17 | 48.41±5.73 a | 11.52±1.46 a,b,c | 9.76±1.56 | 22.11±3.19 | 163.00±7.59 | 60.60±10.80 |
| 3rd | 21 | 51.87±5.36 | 12.95±1.32c | 10.71±1.65 | 23.62±3.09 | 164.85±4.37 | 60.01±6.85 |
| p-value | - | 0.007 | 0.001 | 0.167 | 0.090 | 0.311 | 0.087 |
| η 2 | - | 0.243 | 0.544 | 0.134 | 0.054 | 0.045 | 0.068 |
| Position | N=66 | Mean of VO2max/kg (kg-1.min-1) | vV̇O2max (km/h) | vAT (km/h) | Age (y) | Height (cm) | Weight (kg) |
| GK | 6 | 50.51±9.38 | 12.00±2.09 | 9.66±1.50 | 21.83±3.65 | 169.00±5.83 | 65.58±12.16 |
| DEF | 25 | 51.10±5.17 | 12.48±1.22 | 10.52±1.80 | 24.16±2.82 | 166.44±4.89 | 60.24±7.90 |
| MIDF | 22 | 52.84±5.49 | 13.13±1.39 | 10.81±1.59 | 22.68±2.06 | 159.77±4.84 | 55.25±3.77 |
| ATT | 13 | 52.48±3.95 | 12.84±1.62 | 10.46±1.66 | 23.84±4.74 | 165.76±6.02 | 58.49±6.71 |
| p-value | - | 0.646 | 0.264 | 0.528 | 0.238 | 0.000 | 0.011 |
| η 2 | - | 0.020 | 0.062 | 0.034 | 0.056 | 0.278 | 0.169 |
| Trend over Time | N=21 | Mean of VO2max/kg (kg-1.min-1) | vV̇O2max (km/h) | vAT (km/h) | Age (y) | Height (cm) | Weight (kg) |
| OT | 11 | 56.89±3.56 | 16.09±0.83 d | 11.77±1.01 | 24.72±5.08 | 167.45±6.31 | 59.32±6.06 |
| NT | 10 | 53.66±4.42 | 13.40±0.96 d | 10.60±1.64 | 22.30±1.63 | 166.90±5.48 | 58.70±5.29 |
| p-value | - | 0.080 | 0.000 | 0.071 | 0.159 | 0.833 | 0.804 |
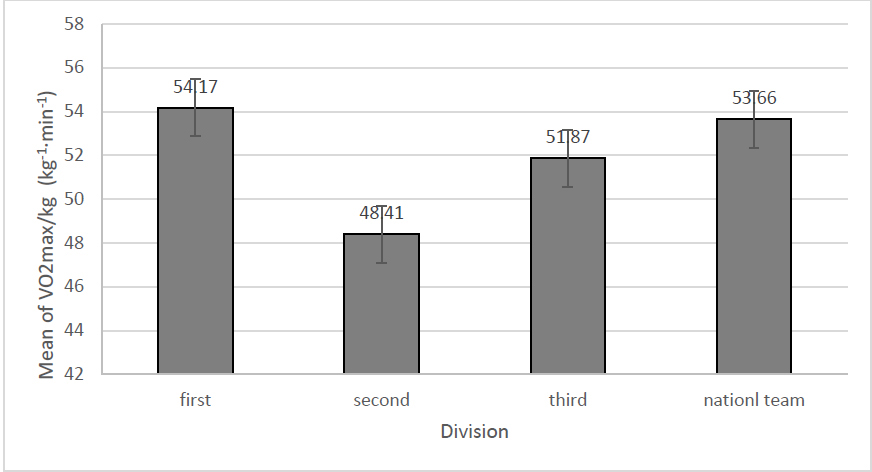
Differences in VO2max in players between different divisions.

Differences in VO2max in players between different positions.
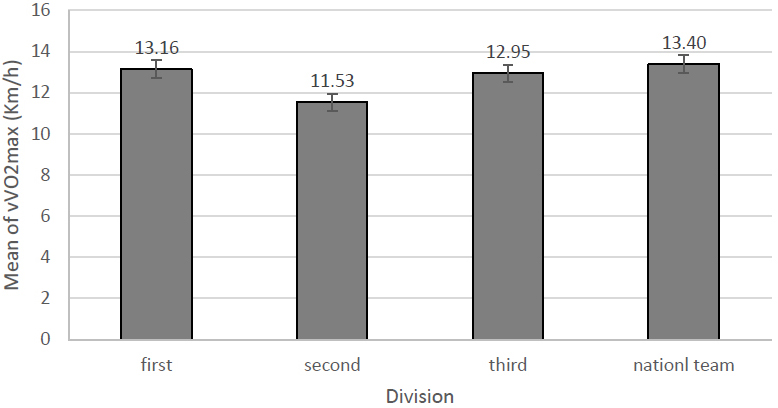
Differences in vVO2max in players between different divisions.
| - | Weight | Mean of VO2max/kg (kg-1.min-1) | VO2MAX KGR | VVO2MAX | MHR | HRVO2MAX | VE | AT | VAT | |
|---|---|---|---|---|---|---|---|---|---|---|
| Weight | Pearson Correlation | 1 | 0,505** | -0,516** | -0,278* | -0,087 | 0,121 | 0,325** | 0,049 | -0,214 |
| Sig. (2-tailed) | - | 0,000 | 0,000 | 0,022 | 0,482 | 0,439 | 0,007 | 0,697 | 0,079 | |
| N | 68 | 67 | 68 | 68 | 68 | 43 | 67 | 65 | 68 | |
*. Correlation is significant at the 0.05 level (2-tailed).
3.2. vV̇O2max
Significant differences were revealed in vV̇O2max between players of different divisions (F=6.63, p < 0.05). The post hoc test (Scheffe) indicated significant differences between the second division and players of all other divisions (second and first, second and third, second and NT), with NT players performing better than all other players. No differences were found between players with different playing positions in the game (Table 1 and Fig. (3)).
3.3. vAT
No significant differences in vAT were observed between players of different divisions (F=1.75, p > 0.05) and players with different positional roles in the game (F=0.75, p > 0.05). (Table 1).
3.4. V̇O2max Indicator Comparisons
In players’ HR, V̇O2max/L, and AT data, no statistically significant differences were observed in all comparisons.
3.5. Trend over Time: 2004 National Team (Olympic Team) and Recent National Team Players Comparison
Significant differences were revealed only in vV̇O2max between players of the OT and players of the recent NT, (F=- 6.86, p < .05) with OT players performing better. No statistically significant differences were found in all other V̇O2max indicators (Table 1).
3.6. Correlation Examination
Pearson's correlation was used to examine the correlations between weight and VO2MAXL, VO2MAXKGR, VVO2MAX, MHR, HRVO2MAX, VE, AT, VAT. The results show that weight has a moderate positive correlation with VO2MAXL (r = 0.505, p < 0.01). However, when VO2MAXKGR is expressed in relation to body weight, there is a moderate negative correlation (r = -0.516, p < 0.01), meaning that as weight increases, oxygen consumption decreases. In addition, weight shows a weak negative correlation with VV02MAX (r = -0.278, p < 0.05), meaning that higher weight is associated with lower running speeds at maximal oxygen uptake. A moderate positive correlation (r = 0.325, p < 0.01) was also observed between weight and VE, indicating that the greater the weight, the greater the VE. There were no statistically significant correlations between the rest of the variables (Table 2).
4. DISCUSSION
This study offers a comprehensive analysis of aerobic capacity differences among female soccer players by comparing performance levels and playing positions, while also incorporating a rare longitudinal perspective. The investigation into V̇O2max indicators across elite, sub-elite, and lower-level players revealed not only expected patterns but also surprising deviations that challenge prevailing assumptions in the literature. Notably, the absence of significant differences among playing positions and the superior aerobic performance of some lower-division players highlight the nuanced nature of physiological development in women’s soccer. One of the key strengths of this study lies in its multidimensional design: it integrates a robust sample of current and former elite athletes, employs laboratory-based maximal testing protocols, and includes advanced indicators such as vV̇O2max and vAT. Furthermore, by drawing comparisons over a 20-year time frame, the study provides valuable insight into the evolution of aerobic conditioning in elite female players—an area that remains largely underexplored. These findings underscore the importance of individualized, data-driven training approaches and open new directions for optimizing endurance development in female soccer. In more detail:
4.1. Performance Level (Different divisions)
4.1.1. V̇O2max
This study is one of the very few that examines V̇O2max and V̇O2max indicators characteristics from different performance level players (from elite to lower performance level) in female soccer players [6, 11]. In the present study, test results revealed V̇O2max values between 43.50-66.30 mL.kg-1.min-1, comparable with values from other studies [1, 4-7, 11, 13, 15].
Our results indicated that first division players (the highest division) had better V̇O2max than second division players, which was statistically significant, and also than third division players, but surprisingly, these differences were not statistically significant. Concerning NT players, the results indicated that they had better V̇O2max than second and third division players (but also with no statistically significant differences). These findings are in agreement with those of other researchers [1, 2, 6, 11, 13, 20], who concluded that these differences from higher to lower competition levels can be attributed to the greater demands of the game. A high level of physical fitness is needed, on a physiological basis, to cope with the elevated physical demands of the game at higher performance levels [11, 29].
These results are consistent with previous studies [30-33] that demonstrated a positive relationship between aerobic capacity (VO2max) and the running demands of the game, including total distance covered, high-intensity runs, and repeated-sprint ability (RSA). These studies also reported that female players competing at higher levels of competition tend to have greater aerobic capacity and, consequently, enhanced running performance. Furthermore, it is well established that high-performance female players exhibit greater match demands—covering longer distances, performing more high-intensity runs, and executing more sprints—compared to their lower-level counterparts [12, 34, 35].
Our study results also indicated that first division players who are not members of the NT had overall better V̇O2max than NT players (but not statistically significant) and third division players had better V̇O2max than second division players (but not significantly different).
These results are novel and indicated, unlike any other study to our knowledge, that players with lower performance levels had better V̇O2max values than higher-level players. All other studies on women soccer players so far have supported that V̇O2max is performance level dependent (with higher performance level players achieving higher V̇O2max) [1, 14, 15, 18]. The differences found in our study could be attributed to the effects of training and the quality of the training programs, which is a key element for the explanation of these differences. Training programs adjusted to players' capabilities could increase their physical potential. Also, specialized training programs focusing on physical performance and selecting appropriate training loads and intensities could improve players' physical characteristics [11, 36]. Similar results were found in the study by Tonnensen et al. (2014) [37] for male soccer players, where the researchers found no significant differences between different performance levels.
Focusing especially on the better physical performance of third division players compared to second division players, this difference cannot be attributed to the number of games per season (14 matches per season for both categories), nor the training volume of the two different divisions throughout the season (3 sessions per week, 90’ duration for each session, for both categories). An interesting element of third division players' performance is that most of the examined female players had only a few years of training experience in soccer, but had lengthy previous training experience in other sports (according to their interviews). Consequently, players could tolerate increased load and intensity of training from their early steps in soccer training and have better adaptation to enhanced training demands.
4.1.2. vV̇O2max
Theoretically, vV̇O2max could be a better indicator of match performance than V̇O2max since it can reflect the player’s running economy in addition to V̇O2max [13, 14]. According to other researchers, vV̇O2max is closely linked with V̇O2max and represents an important endurance capacity indicator [7, 8, 14]. Furthermore, researchers have indicated that V̇O2max and vV̇O2max assessment can distinguish between female players of different performance levels, with higher-level athletes having higher values [4, 7, 8, 14].
In the present study, vV̇O2max and V̇O2max values are highly correlated (r=0.701, p≤ 0.05) and exhibit a similar pattern. Concerning vV̇O2max, the results indicated a statistically significant lower performance only for the second division players compared with all other division players. No differences in vV̇O2max were found between NT, first, and third division players.
This is, again, the first study to our knowledge that examined vV̇O2max in female soccer players, in a range of performance levels. Other researchers have investigated vV̇O2max and V̇O2max of female players [4, 7, 8, 14] according only to the position of the players. Due to the trivial evidence from previous studies, we based our explanation for vV̇O2max on findings for V̇O2max. We therefore hypothesized that the findings of our study agree with those of other researchers [1, 4, 8, 11, 14], who concluded that differences in V̇O2max can be explained by the higher demands of the game. At higher performance levels, a high level of physical fitness is needed [11, 29].
Likewise, for the V̇O2max results, in the present study, players of the second division had lower performance (statistically significant) in vV̇O2max than third division players. These results are again novel. These findings indicated that players with lower performance levels had better vV̇O2max values than higher-level female soccer players, unlike other studies that reported opposite findings [1, 4, 7, 8, 14]. According to our results, vV̇O2max is not performance level dependent (where higher performance level players are achieving higher vV̇O2max). As argued previously, training programs with the appropriate training load and intensity could enhance players' performance [11, 36] and consequently explain these differences, resulting from training adaptations (training-dependent differences). Tonnensen et al. (2014) [37] also found no significant differences between different performance levels of players and came to the same conclusion concerning V̇O2max and vV̇O2max in their study on male soccer players.
Again, the differences in vV̇O2max between second and third division players could not be explained by differences in training loads (frequency and duration of training sessions), which were the same for both categories (second and third division).
No statistically significant differences were found in AT, vAT, HR, and V̇O2max/L for different division players. No data exist to our knowledge from previous studies concerning comparisons of these V̇O2max indicators in different performance level players. The findings of our study indicated that these V̇O2max indicators are also not performance level dependent.
4.2. Playing Position
Numerous studies have examined possible differences in physiological characteristics between different playing positions [1, 4, 7, 11, 15]. V̇O2max indicators such as vV̇O2max, AT, and vAT are important endurance capacity and running economy determinants and, therefore, important elements in performance and training scheduling [7, 8] and were included in our study.
No statistically significant differences in V̇O2max between different playing position players were found in the present research. Nevertheless, small differences but not significant were found, with MIDF having higher V̇O2max than GK (as expected) and DEF. We also found similar V̇O2max performance between MIDF and ATT. As mentioned earlier, maximal aerobic capacity indicators (vV̇O2max, AT, vAT) in the present research followed the V̇O2max pattern, and like V̇O2max no differences were found between different positional players.
These findings agree with those of recent studies [1, 4, 7, 15], which found no significant differences in V̇O2max between the different playing positions, although some of them mentioned slightly higher V̇O2max values for MIDF [7, 8, 14]. Earlier studies also reported similar findings [38, 39].
This absence of differences could be attributed to the poor classification of playing positions in only four categories (Goalkeepers, Defenders, Midfielders, and Attackers). Perhaps a more detailed classification of playing positions, including at least six categories (Goalkeepers, Center Defenders, External Defenders, Central Midfielders, External Midfielders, and Forwards) could provide us with more information. Differences in the maximal aerobic capacity of female soccer players may be missed when a general classification of playing positions is used [11].
Another possible explanation for these results could probably be found in the contents of the training programs that players in the study followed throughout the season. Training programs with no position-specific oriented training in physical conditioning could impair their V̇O2max and V̇O2max indicator performance and eliminate any differences between different playing position players [4, 15]. Future research with training content reports may shed light on this area.
The findings of our research do not agree with those of Haugen et al. (2014) [8], who found statistically significant differences in V̇O2max between MIDF and GK, with MIDF performing better than GK. The researchers also reported differences, but not statistically significant ones, with MIDF performing better than DEF and ATT (Haugen et al., 2014) [8]. Our findings also disagree with those of Jagim et al. (2020) [35] Mäkiniemi et al. (2022) [40], Griffin et al. (2020) [41], who reported central midfielders (CM) performing the highest total distance covered in a match. Since running performance is positively related to aerobic capacity [30-33], it is well assumed that MIDF has higher aerobic capacity than other position players.
4.3. Trend Over Time
This is the second study that has examined V̇O2max characteristics over a long period. Only one study to our knowledge has examined the trend over time in female soccer players, finding a slight but not significant trend toward lower V̇O2max [8]. In the present study, we reached the same outcome. Current NT players achieved lower values compared to the OT of the 2004 Olympic Games. They exhibit a slightly lower but not statistically significant trend in all V̇O2max indicators, except in vV̇O2max, where they exhibit lower values but statistically significant differences. Concerning vV̇O2max, we hypothesized that these differences could be attributed to the slightly different duration of the protocol stages in the V̇O2max evaluation. The OT players were examined in a two-minute stages protocol until exhaustion, while players in the current NT were examined in a three-minute stages protocol (according to the researcher’s notes). Therefore, the OT players reached statistically significantly higher velocities in their V̇O2max assessments. Future research that integrates GPS training monitoring and lifestyle assessments could better explain temporal trends.
5. STUDY LIMITATIONS
This study is not without limitations. Firstly, training loads and lifestyle factors were not recorded and consequently were not correlated with VO2max changes. The use of GPS devices could provide further insight into player performance. In the present study, as well as many other studies, reported only four major player position classifications. A more detailed classification of playing positions, including at least six categories (Goalkeepers, Center Defenders, External Defenders, Central Midfielders, External Midfielders, and Forwards), could provide more detailed information. Future research should integrate multidimensional assessments to gain a more comprehensive understanding of performance determinants in female soccer.
CONCLUSION
The present study provides evidence that aerobic capacity and its indicators in female soccer players across different performance levels are influenced more by training adaptations than by competition level. This unexpected finding challenges the traditional assumption that higher-level players consistently exhibit superior aerobic fitness. The best V̇O2max performance in this study was observed in a third division midfielder (66.30 mL.kg-1.min-1), emphasizing the role of individualized training programs and previous athletic background in determining aerobic capacity. No significant differences were found in V̇O2max and its related indicators among players with different playing positions, suggesting that aerobic fitness may not be position-dependent in female soccer players. This aligns with recent research, which indicates that modern training regimens might not be sufficiently position-specific in terms of endurance training. Future studies should explore whether a more detailed classification of playing positions or tailored conditioning programs could reveal previously undetected differences. A slight but notable trend toward lower aerobic capacity was observed in elite players over the 20 years (2004-2024). This decline, although not statistically significant for most indicators except vV̇O2max, could be attributed to shifts in training methodologies, changes in match demands, or a greater emphasis on other physical attributes such as speed and strength in modern soccer. Further investigation is needed to determine whether these trends reflect broader changes in women’s soccer performance standards.
PRACTICAL APPLICATIONS
The findings of this study have significant implications for coaches and conditioning specialists. V̇O2max indicators should be used as a critical tool for monitoring player fitness, identifying talented athletes, and tailoring training interventions. The fact that players from lower divisions exhibited competitive aerobic capacity suggests that effective training programs can optimize fitness levels regardless of competitive tier. This highlights the importance of individualized and well-structured conditioning programs to enhance player endurance and overall performance. Additionally, the absence of positional differences in aerobic capacity suggests that all players, regardless of their role on the field, should undergo comprehensive endurance training. Future research should examine whether more position-specific aerobic training could provide a competitive advantage. Finally, the observed decline in aerobic capacity over the past two decades underscores the need to reassess current training methodologies in elite female soccer. Monitoring long-term fitness trends can help ensure that physical conditioning keeps pace with the evolving demands of the sport. By leveraging these insights, training programs can be refined to maintain and improve the aerobic performance of female soccer players in the future.
AUTHORS’ CONTRIBUTIONS
All authors contributed significantly to the final version of this manuscript and to the interpretation of the results. E.S.: Literature review, data collection, and manuscript writing; E. S. and X.K.: Conceptualization, study design, statistical analysis support, supervision, as well as assisted in manuscript preparation; A.L.: Contributed to methodology design, data interpretation, and critical revision of the manuscript, as well as assisted in manuscript preparation; G. S.: Statistical analysis support, data organization, data analysis, and drafting of specific sections; E.S., A.L., G.S., V.S., Z.A., D.M., D.H: Technical support, data processing, and contribution to the discussion and conclusions; E.S. A.L., G.S.: Visualization. All authors have read and agreed to the published version of the manuscript.
LIST OF ABBREVIATIONS
| VO2max | = Maximal Oxygen Uptake |
| vV̇O2max | = velocity at V̇O2max |
| HR | = Heart Rate |
| AT | = Anaerobic Threshold |
| vAT | = velocity at AT |
| GPS | = Global Positioning System |
| NT | = National Team |
| OT | = Olympic Team |
| GK | = Goalkeepers |
| DEF | = Defenders |
| MIDF | = Midfielders |
| ATT | = Attackers |
| RSA | = Repeated-Sprint Ability |
ETHICS APPROVAL AND CONSENT TO PARTICIPATE
The study was approved by Aristotle University of Thessaloniki, Institutional Review Board, Greece (approval number 28/2022).
HUMAN AND ANIMAL RIGHT
All procedures performed in studies involving human participants were in accordance with the ethical standards of institutional and/or research committee and with the 1975 Declaration of Helsinki, as revised in 2013.
CONSENT FOR PUBLICATION
Written informed consent for participation in the study and for the publication of anonymized data was signed by all participants before any testing procedure.
AVAILABILITY OF DATA AND MATERIALS
The data supporting the findings of the article will be available from the corresponding author [E.S] upon reasonable request.
ACKNOWLEDGEMENTS
Declared none.