All published articles of this journal are available on ScienceDirect.

Cross-cultural Adaptation, Validity, and Reliability of the Borg Rating of Perceived Exertion CR-10 Scale in Portuguese Adolescents
Authors Info & Affiliations
Abstract
Introduction
The present investigation carried out a cross-cultural adaptation of the category-ratio Borg Scale (Borg CR - 10 scale) into Portuguese. It assessed its content validity and reliability during adolescents' progressive aerobic capacity test in school.
Methods
In the first phase, a cross-cultural adaptation and content validity analysis of the Borg CR-10 scale were performed, followed by a pilot study that tested the clarity of the adapted scale (n = 20, mean age of 16.20 ± 1.40 years). Content validity was verified through experts, and reliability was assessed using heart rate (HR) and Rating of Perceived Exertion (RPE) correlation during a progressive shuttle run. In the second phase, 172 adolescents (mean age of 14.50 ± 1.94 years) performed a 20-meter shuttle run test. At each stage, participants reported their RPE, and HR was recorded.
Results
The adapted Portuguese Borg CR-10 scale demonstrated excellent content validity (CVC = 0.993) and stage-dependent reliability, with higher agreement between RPE and HR observed in the advanced stages of the 20-meter shuttle run test (e.g., ICC = 0.96 at stage 12). Kendall's tau correlation was used to assess the correlation between RPE and HR across the 20-meter shuttle run test stages.
Discussion
Stronger correlations between RPE and HR at higher exercise intensities suggest that the Portuguese Borg CR-10 scale is particularly reliable among adolescents with greater physical fitness and training experience.
Conclusion
These findings support using the Portuguese Borg CR-10 scale as a valid and reliable tool for assessing perceived exertion in adolescents, particularly those with higher cardiorespiratory fitness levels. The scale is suitable for application in school-based physical education settings, offering a practical alternative to more costly physiological monitoring methods.
1. INTRODUCTION
Physical activity (PA) levels in children and adolescents are associated with numerous components, including physical education (PE) classes, extracurricular activities, recess, active travel to school, school-based interventions, etc. These activities are essential for the health and well-being of children and adolescents [1-5]. Despite that, the latest PA report for the Portuguese population [6] showed that only 30.2% of adolescents aged 13 to 18 meet the World Health Organization's current recommendations. Several factors may influence these results, such as increased screen time, lack of access to safe and affordable places to exercise in the neighborhood, new school policies, and the PE class itself. This investigation pioneers adapting and validating the Borg CR-10 scale within Portuguese educational settings, addressing a research gap in cross-cultural applications of exertion scales.
PE is the most important class in a school day and one of the most important activities to promote children's PA. Investigations have examined a wide range of aspects of these classes, showing that PE is positively associated with moderate-to-vigorous PA [7], that polythematic classes induce higher PA levels compared to monothematic ones [8], and that they are an optimal setting for promoting motor competence, learning, and development [9]. This situation underscores the need for reliable and accessible methods like the Borg CR-10 Scale, as supported by research indicating its effectiveness in reflecting physiological markers of activity intensity.
The assessment of the intensity of PE classes remains challenging as commonly used devices to measure it (e.g., accelerometers) are expensive, and many PE teachers and schools cannot afford them. Therefore, developing new, more affordable methods to control and monitor the intensity of activities during PE classes is essential to promote PA in this population. The outcomes of this validation will have direct implications for enhancing the effectiveness of PE classes, promoting higher levels of PA, and contributing to students' overall health. PE teachers design a variety of activities to promote learning and increase PA levels during their classes. Nevertheless, students’ perceived exertion during these activities is still given little attention. Our approach involves a detailed cross-cultural adaptation of the Borg CR-10 scale into Portuguese, followed by rigorous validation procedures. This method aligns with the recommended scale adaptation and validation practices in cross-cultural research [10-12]. Perceived exertion is another factor that needs attention during PE classes [13]. Borg (1970) has stated that perceived exertion is the perception of how hard and strenuous PA is and, therefore, can represent the state of physiological and psychological aspects [14]. We anticipate that this study will confirm the scale's applicability and reliability in a new cultural context and enhance the understanding and effectiveness of perceived exertion measures in promoting physical activity among youth.
Conventionally, the Rating of Perceived Exertion (RPE) is understood as the integration of muscles, joints, and ventilation (peripheral and ventilatory signals) that produce the perception of exertion during physical tasks [14-16]. The main goal is to quantify a person's subjective perceived exertion [17, 18]. In the latter part of the 20th century, Borg (1998) proposed a new approach to the classical methods of RPE (6-20 scale). The Category-Ratio Borg Scale (Borg CR-10) represents the relationship between heart rate and oxygen consumption, which are physiological measures of exertion [19]. It includes verbal descriptions relating to numerical categories, allowing participants to accurately assess their exertion and enabling comparisons either between individuals or within the same individual over time [18, 19]. Over time, the Borg CR-10 scale has been used within other fields of expertise, such as during PA, exercise, and sports [15, 20-24], and across age groups [25-28]. Despite its usability and ease of use, the Borg CR-10 scale is commonly found arbitrarily, with colored scales and/or varied terms and instructions, without a correct validation process. As pointed out in the literature [18], proper use is necessary since these elements directly influence what will be reported.
Since the original Borg CR-10 scale was developed in English, a full cross-cultural adaptation is necessary for Portuguese. Other Borg Perceived Exertion Scale versions have been cross-culturally translated into Portuguese (e.g., 6-20 scale) [18]. Thus, when testing individuals with different physical fitness levels at the same exercise protocol, the RPE scale may be a valuable tool to differentiate them [18, 29]. However, doubts remain about its applicability to school-aged children and adolescents. Therefore, the main goal of this investigation was to perform a cross-cultural adaptation of the Borg CR-10 scale into the Portuguese language and assess its content validity. Additionally, it explored the reliability of RPE responses compared to physiological responses during exertion.
2. MATERIAL AND METHODS
2.1. Study Design
This investigation was developed in two phases. In the first phase, a cross-cultural adaptation of the Borg CR-10 scale was conducted, and its content validity was assessed through expert analysis. During the second phase, the concurrent and discriminant validity of the adapted Borg CR-10 scale was tested among Portuguese adolescents. Verbal informed consent was obtained from all participants, and written informed consent was obtained from parents/guardians before the start of the data collection. All the school boards (n = 4) signed a document authorizing data collection. The University Ethics Committee (process number: P02-S09-27/04/2022) approved the investigation, and the study protocol followed all the Declaration of Helsinki guidelines [30].
2.1.1. First Phase
2.1.1.1. Cross-cultural Adaptation
The cross-cultural adaptation procedures followed previous literature [18, 31]. Two bilingual, experienced professors individually translated the original English version of the Borg CR-10 scale and its instructions into Portuguese. Subsequently, the two versions were combined by sports scientists (FF and NC), producing a standardized scale translated into Portuguese. As suggested by Brislin [32] and Beaton et al. [33], the merged Portuguese version was back-translated into English by the same two experienced bilingual professors to confirm that the second English version retained the same content as the original scale. Finally, the two English versions were grouped into a brand-new version, following the earlier procedures.
In the final stage, the equivalence of the scales was assessed using a Likert scale from 1 to 4 (1 = not equivalent; 2 = need great revision to be equivalent; 3 = need small revision to be equivalent; 4 = equivalent, no revision needed). Therefore, the final Portuguese version of the Borg CR-10 was completed.
2.1.1.2. Content Validity
Content validity was performed by 10 expert sports scientists who had previously received explanations about the Borg CR-10 scale. A 5-point Likert Scale was used to assess content validity (1 = very poor; 2 = poor; 3 = acceptable; 4 = good; 5 = very good). The experts answered questions about clarity of language, practical relevance, and theoretical relevance (Table 1).
After the experts had answered the assessment tool, the Content Validity Coefficient (CVC) indicators were calculated. All CVCs should have an agreement of more than 80% [34]. The items' CVC ranged from 0.90 to 1.00 (minimum expected of 0.78), and the CVC of the scale was set at .993.
2.1.1.3. Pilot Study
The main goal of the pilot study was to assess the clarity and understanding of the scale, contributing to content validity verification. Hence, to test the viability and clarity of the Portuguese version of the Borg CR-10, 10 young males and 10 young females reported their perceived exertion using the new scale (Table 2). The same protocol was used for the pilot study as the final sample. The instructions for the Borg CR-10 scale were given before the 20-meter shuttle run test began.
After the test, participants were asked to indicate any difficulties in understanding the scale. Participants were also asked to suggest changes to the Borg CR-10 scale. None of the participants indicated any difficulties in understanding the new version of the instrument, so making any changes was unnecessary. Therefore, the final version of the Borg CR-10 scale in Portuguese was ready to be used in the second phase of the present investigation (Table 3).
| Category | Questions | 5-point Likert Scale | ||||
|---|---|---|---|---|---|---|
| 1 | 2 | 3 | 4 | 5 | ||
| Clarity of the language | “Considering the instrument's language and the respondent's features, do you believe the language is sufficiently clear, understandable, and appropriate for these populations? At what level?” | |||||
| Practical pertinence | “Considering that the instrument is relevant to evaluate the RPE concept in a specific population, do you believe the proposed instrument is relevant to these populations? At what level?” | |||||
| Theoretical relevance | “Considering the relationship between the instrument and the RPE theory, do you believe that the instrument's content represents either what is to be measured or its dimension, considering the theory in question? At what level?” | |||||
| - | Males + Females | Males | Females | ||||||
|---|---|---|---|---|---|---|---|---|---|
| N | Mean | SD | N | Mean | SD | N | Mean | SD | |
| Age (yr) | 20 | 16.20 | 1.40 | 10 | 16.60 | 1.51 | 10 | 15.80 | 1.23 |
| Body mass (kg) | 20 | 60.90 | 10.31 | 10 | 65.40 | 10.93 | 10 | 56.40 | 7.75 |
| Height (m) | 20 | 1.68 | 0.09 | 10 | 1.73 | 0.07 | 10 | 1.62 | 0.08 |
| BMI (kg /m2) | 20 | 21.60 | 2.36 | 10 | 21.83 | 2.50 | 10 | 21.36 | 2.33 |
| Borg Scale (CR-10) | Portuguese Borg CR-10 Scale | ||||
|---|---|---|---|---|---|
| a) Original Borg CR-10 scale, in English. | b) New Borg CR-10 scale, in Portuguese. | ||||
| 0 | Nothing at all | 0 | Nada | ||
| 0.5 | Extremely weak | (just noticeable) | 0.5 | Extremamente fraco | (levemente percetível) |
| 1 | Very weak | 1 | Muito fraco | ||
| 2 | Weak | (light) | 2 | Fraco | (leve) |
| 3 | Moderate | 3 | Moderado | ||
| 4 | - | 4 | - | ||
| 5 | Strong | (heavy) | 5 | Forte | (pesado) |
| 6 | - | 6 | - | ||
| 7 | Very strong | 7 | Muito forte | ||
| 8 | - | 8 | - | ||
| 9 | - | 9 | - | ||
| 10 | Extremely strong | (almost max) | 10 | Extremamente forte | (quase máximo) |
| - | Maximal | - | Máximo | ||
| - | Males + Females | Males | Females | |||||||
|---|---|---|---|---|---|---|---|---|---|---|
| N | Mean | SD | N | Mean | SD | N | Mean | SD | ||
| Age (yr) | 172 | 14.52 | 1.94 | 91 | 14.66 | 2.10 | 81 | 14.36 | 1.74 | |
| Body mass (kg) | 172 | 55.90 | 11.13 | 91 | 58.30 | 11.75 | 81 | 53.02 | 9.67 | |
| Height (m) | 172 | 1.64 | 0.10 | 91 | 1.67 | 0.11 | 81 | 1.60 | 0.08 | |
| BMI (kg /m2) | 172 | 20.56 | 3.27 | 91 | 20.39 | 3.48 | 81 | 20.77 | 3.00 | |
2.1.2. Second Phase Sample
The sample size was determined using the G*Power v.3.1.9.7 software (Kiel University, Kiel, Germany) [35], considering the following parameters: Cohen's effect size of 0.35 for ANOVA two-way, error probability α = 0.05, and β = 0.80. This calculation resulted in a sample size of 142 participants. A total of 172 participants (91 males and 81 females) aged 11 and 17 years were randomly recruited from different public schools in Portugal's central region (Table 4). The inclusion criteria were as follows: (a) absence of injury or illness within the last four consecutive weeks; (b) participation in PE classes (twice a week – between 50 and 100 minutes per class); (c) being a student from middle to high school. Children taking medication that could potentially influence the outcomes of the current investigation were excluded from the sample.
2.1.2.1. Experimental Design
An analytical observational cohort study was conducted. Adolescents were assessed in a school setting, in which an anthropometric assessment (weight and height) was performed, followed by a demographic data collection.
Before the cardiorespiratory test (20-meter shuttle run), all participants were familiarized with the new Portuguese Borg CR-10 scale (see RPE section) using standard instructions [36] to avoid invalid values. During the test, each participant had to select a number on the scale to rate their overall exertion during the exercise. A zero-rating score was associated with no exertion (nothing at all), while a score of 10 represented maximal exertion (extremely strong). The participants' answers were individually provided using an iPad. Simultaneously, each participant wore a Polar® H10 monitor near the xiphoid appendix to monitor heart rate (HR). RPE and HR were recorded once per stage. Reliability was interpreted through the consistency of responses across increasing intensities.
2.1.2.2. Rating of Perceived Exertion
Perceived exertion was defined according to Borg's definition: “a perception of how hard and strenuous a physical task is” [14, 19]. Before starting the 20-meter shuttle run test, the participants read the scale and its instructions. Then, the researcher explained the scale and its general instructions, pointing out how to respond correctly and highlighting the memory anchoring (Fig. 1).
Memory anchoring included encouraging participants to associate the low and high ends of the exertion scale with familiar experiences, such as resting (0) and moments of maximal effort (10), thus guiding participants while answering the Borg CR-10 scale. The following procedures were administrated to guarantee that participants could establish a range of sensations they had experienced previously. The zero point (minimum value of the scale) corresponds to “no exertion at all” and should be associated with resting. The 10-point scale corresponds to maximal exertion; thus, the participant should perceive an extreme exertion. The final point of the scale is the “maximal” exertion, in which the participant cannot continue the exercise and needs to finish the run.
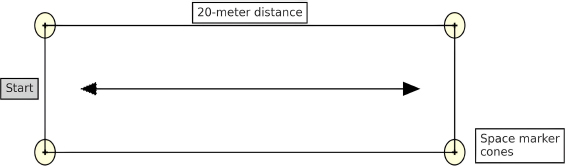
Visual presentation of the 20-meters huttle run test.
2.1.2.3. Experimental Protocol
The 20-meter shuttle run test consisted of participants running the maximum 20-meter runs at a predetermined pace (Fig. 1). At the beep, each participant reversed the direction and ran to the other end. If participants reached the line before the beep, they waited for the next signal to run in the opposite direction.
The speed of the test started at 8.5 km/h and increased by 0.5 km/h every minute (1 min = 1 step). A beep indicated the end of a 20-meter run, and a triple beep indicated the end of the step. Participants were required to stay in the test as long as possible and to stop when they reached the line before the audio signal on two occasions, not necessarily consecutively. The first fault was counted towards the result. Cardiorespiratory capacity (below, healthy, or athletic zone) was determined using the reference values presented on the FITescola® website [37].
2.2. Data Analysis
Descriptive statistics with mean and standard deviation were used to characterize the data. The content validity was assessed by calculating the CVC for the clarity of language, the practical pertinence, and the theoretical relevance of the Portuguese Borg CR-10 scale. The normality of the data was used using the Kolmogorov-Smirnov test (p > 0.05) and the Levene test (p > 0.05). The two-way ANOVA was used to compare age, height, weight, BMI, and number of weekly workouts concerning sex. Reliability was verified by Intraclass Correlation Coefficient (ICC) analysis, with a magnitude of absence: low: ICC = 0 - 0.19; weak: ICC = 0.20 - 0.39; moderate: ICC = 0.30 - 0.59; substantial: ICC = 0.60 - 0.79; and almost complete: ICC ≥ 0.80 [38]. The two-way ANOVA was used to compare age, height, weight, BMI, and number of weekly workouts concerning sex. Kendall's tau correlation was used to assess the correlation between RPE and HR across the stages of the 20-meter shuttle run test due to the ordinal nature of RPE. The Statistical Package for Social Sciences (SPSS, v. 29.0) software was used, with an alpha significance level of 0.05.
3. RESULTS
Regarding sex differences, our results showed that males were taller and heavier than females. Regarding cardiorespiratory capacity, it was observed that both males and females in the healthy zone were older and taller. However, participants below the healthy zone were heavier than those in the healthy and athletic zone. Furthermore, the athletic-level participants have a lower BMI and a higher number of workouts per week than those in the healthy zone. We also observed that both girls and boys achieved 95% or more of their predicted maximum HR, with boys reaching slightly higher maximum values. It was also shown that adolescents who did not reach the healthy zone had lower RPE values (Table 5).
| Variables | Males (n= 91) | Females (n= 81) | ||||
|---|---|---|---|---|---|---|
| M±SD | M±SD | M±SD | M±SD | M±SD | M±SD | |
| Z1 (n= 19) | Z2 (n= 38) | Z3 (n= 34) | Z1 (n= 32) | Z2 (n= 27) | Z3 (n= 22) | |
| Age (yr)b,c* | 14.58±1.46 | 15.18±1.71 | 14.12±2.65 | 15.00±1.46 | 14.41±1.45 | 13.36±2.03 |
| Height (m)c,d* | 1.68±0.06 | 1.71±0.11 | 1.63±0.12 | 1.62±0.07 | 1.60±0.07 | 1.57±0.08 |
| Body Mass (kg)b,c,d* | 62.29±7.49 | 60.09±11.64 | 54.06±12.75 | 58.43±9.18 | 50.92±7.95 | 47.95±8.64 |
| Body Mass Index (kg /m2)a,b* | 21.98±2.65 | 19.98±4.29 | 19.95±2.60 | 22.29±3.14 | 20.09±2.39 | 19.42±2.52 |
| Weekly training (days)a,b* | 1.58±1.46 | 2.53±1.86 | 3.21±1.43 | 1.25±1.74 | 2.33±2.06 | 2.73±2.33 |
| Predict HR (bpm) | 197.74±1.11 | 197.49±1.02 | 197.53±1.59 | 197.60±0.95 | 197.73±1.36 | 198.61±1.51 |
| Max HR (bpm) | 188.47±16.50 | 194.70±17.49 | 193.32±10.83 | 188.67±15.70 | 191.65±15.81 | 189.45±18.34 |
| % HR Max reach (%) | 95.32±8.47 | 98.60±9.02 | 97.89±5.79 | 95.49±7.99 | 96.96±8.27 | 95.42±9.51 |
| Max RPE | 7.29±2.17 | 8.78±1.51 | 9.76±0.74 | 8.23±2.07 | 9.58±1.03 | 10.00±0.00 |
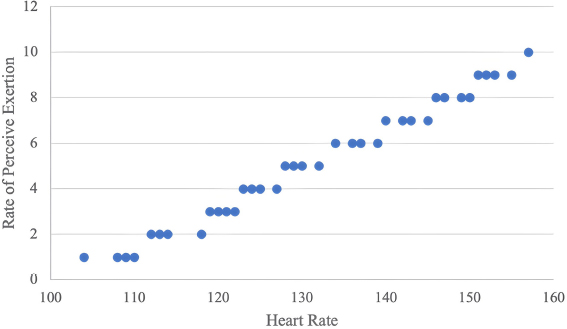
Scatter plot showing the relationship between HR and RPE. Note: Each point represents a single-stage intensity.
| - | S1 (n=172) |
S2 (n=171) |
S3 (n=168) |
S4 (n=158) |
S5 (n=131) |
S6 (n=110) |
S7 (n=90) |
S8 (n=70) |
S9 (n=50) |
S10 (n=38) |
S11 (n=30) |
S12 (n=23) |
S13 (n=12) |
S14 (n=9) |
Total (n=172) |
|---|---|---|---|---|---|---|---|---|---|---|---|---|---|---|---|
| ICC | 0.11 | 0.22 | 0.34 | 0.41 | 0.42 | 0.45 | 0.53 | 0.54 | 0.50 | 0.60 | 0.65 | 0.96 | 0.95 | 0.82 | 0.49 |
Fig. (2) shows the correlation between HR and RPE, indicating an association between these variables. Based on this analysis, it can be understood that HR and RPE are well correlated during exercise (tau = 0.278; p < 0.0).
Table 6 presents the ICC values, suggesting that these measures are reliable. Higher values were found as the stages progressed (S12, S13, and S14, for example). Although ICC values are descriptive and not tested for significance, values above 0.80 (e.g., ICC = 0.96 at stage 12) reflect “almost complete” reliability. These values indicate stronger RPE-HR agreement at higher exercise intensities.
4. DISCUSSION
This investigation aimed to perform a cross-cultural adaptation of the Borg CR-10 scale into Portuguese, assess its content validity, and examine its reliability during progressive aerobic exercise in Portuguese adolescents.
Initial results confirmed the content validity of the translated scale (CVC = 0.993), with excellent expert agreement regarding clarity, relevance, and theoretical alignment. In addition, results showed a moderate correlation between RPE and HR (tau = 0.278), with significantly stronger associations observed in the higher stages of the 20-meter shuttle run test. This pattern has been reported in the literature. It may reflect a ceiling effect at peak intensity, where both HR and perceived exertion converge toward their maximum values, reducing variability and enhancing agreement. These findings align with previous studies showing that correlation values between RPE and physiological markers (e.g., HR, VO2, lactate) tend to increase as exercise intensity approaches maximal levels [39, 40]. However, lower and more variable RPE responses have been reported in younger populations, likely due to differences in experience, comprehension, and physiological maturity [40, 41].
Since 2008, the Borg CR-10 scale has shown substantial results in evaluating the effectiveness of RPE for predicting maximal oxygen uptake (VO2max) or approximating the duration until voluntary exhaustion in adults [42-44]. Indeed, among a wide range of indicators, VO2max and maximal aerobic speed stand out as fundamental variables capable of elucidating exercise intensity and facilitating the monitoring of athletes' aerobic adaptations throughout different training phases [45]. Since it is very easy to apply and does not require expensive equipment [46, 47], RPE seems to be a valuable tool for monitoring the training intensity in each session and/or exercise. Indeed, Eston and Parfitt 39 showed its applicability with strong relationships found between indicators of exercise intensity (e.g., work, speed, power) and physiological variables (e.g., HR, ventilation, VO2, blood lactate). Nonetheless, most of the studies were conducted in adults (frequently athletes), and thus, their validity in adolescents remains to be fully understood. In a recent scoping review [40] on the use of RPE in children and adolescents, 22 studies were found. In a study involving middle-aged children, it was observed that during incremental maximal cycling exercises [48], children exhibited higher RPE values than young adults. A mean VO2 was measured among children during sustained working exercises [49], with no significant correlation observed between VO2 and RPE. In a study with young swimmers, the authors reported that HR would be a more useful guide than RPE for children [50]. These diminished positive outcomes could potentially stem from the influence of psychological factors on RPE, such as cognitive capacity, memory, prior experience, and task comprehension [41]. Nevertheless, while previous research has revealed discrepancies in children's capacity to regulate exercise intensity, subsequent studies conducted after introducing scales tailored for children propose RPE as a proficient instrument for controlling exercise intensity [40].
A crucial consideration when using RPE with children and adolescents is that asking them to estimate their exertion assumes they can understand and recall the sensations associated with exercising to the point of complete exhaustion. Notably, young children might not have encountered this level of exertion, hence lacking a tangible understanding of the sensation. Using a memory-recall approach to improve children's understanding of perceived exertion presents challenges, as it relies on prior experience and the child's stage of cognitive development [51]. These reasons could account for our improved correlation results in the later stages of the 20-meter shuttle run test since those participants who progressed to higher stages exhibited greater training experience, enabling them to understand their physical limits better. To improve understanding and self-regulation, participants were provided with memory anchoring before the test, in which the researcher explained how to associate familiar physical sensations with the endpoints of the RPE scale (e.g., rest = 0, extreme fatigue = 10), encouraging participants to recall previous experiences of physical exertion. While this method has been used in other studies to guide RPE selection [41, 51], we acknowledge that the absence of actual reference exertions (e.g., low/moderate intensity warm-ups) might have limited the effectiveness of the anchoring strategy.
It is necessary to point out that the maturation process from childhood to adolescence involves significant changes [52]. For instance, advanced maturity stages are linked with lower fat mass [53, 54], a trend reflected in our findings, where older participants achieving higher stages of the 20-meter shuttle run test had lower BMI values (although BMI does not discriminate between fat mass and fat-free mass). Therefore, alterations in lean body mass during puberty may strongly impact the mechanical work rate, associated ventilatory and metabolic functions, and potentially RPE during high-intensity exercise. Moreover, in the exercise context, peak post-exercise blood lactate and glucose levels were consistently lower in pre-pubertal boys than in men, regardless of the exercise mode (cycling or running). Additionally, regardless of age, post-exercise values were lower after cycling than running. This observation suggests that the extent of physiological responses and RPE may be influenced by additional muscle engagement linked to growth and the biomechanics of running [55]. Furthermore, the challenge in RPE could be related to increased active muscle mass, affecting mechanical work during the developmental shift from childhood to late adolescence. However, studies indicate that RPE during high-intensity exercise rises with age [56]. In addition, when comparing sexes, it was observed that at the age of 14 years, a greater RPE during the later stages of a high-intensity interval exercise protocol was observed in boys more than girls, along with comparable HR responses between sexes, despite boys exercising at greater power output [57]. These outcomes underscore the impact of maturation.
Considering the points mentioned earlier, it becomes evident that the present study had a limitation in not measuring the maturation status. However, our sample had a mean age of 14 years, which implies that they have already passed the initial stage of the maturation process (both boys and girls) [52], and they were at an age where higher RPE levels are typically attained. Additionally, our study was not exclusively conducted with athletes, which could have exerted some influence on the subjects' experiences, i.e., the subjects had varied levels of physical exercise experience. Nevertheless, this scenario mirrors the authentic environment of a typical PE class.
CONCLUSION
The present investigation yielded promising results, providing partial confidence in the instrument’s reliability, particularly among individuals with higher cardiorespiratory capacity (i.e., those who completed more stages) and likely greater experience (as indicated by more frequent weekly training sessions). In other words, stronger correlations were observed in the later stages among those subjects who completed more stages, the same individuals who reached an athletic level and exhibited better body composition (lower weight and BMI), and with a higher frequency of weekly training sessions.
AUTHORS’ CONTRIBUTIONS
The authors confirm their contribution to the paper as follows: F.F.: Study conception and design; F.F., N.C.: Analysis and interpretation of results; A.F.S., J.S., V.S., D.S.: Draft manuscript; F.F., R.W.: Methodology; F.F.; P.M.: Data Curation; F.F., D.S., N.C.: Manuscript final version. All authors reviewed the results and approved the final version of the manuscript.
LIST OF ABBREVIATIONS
| RPE | = Rate of Perceived Exertion |
| PA | = Physical Activity |
| PE | = Physical Education |
ETHICS APPROVAL AND CONSENT TO PARTICIPATE
The Piaget Institute Ethics Committee (process number: P02-S09-27/04/2022), Portugal approved the investigation.
HUMAN AND ANIMAL RIGHTS
All procedures performed in studies involving human participants were in accordance with the ethical standards of institutional and/or research committees and with the 1975 Declaration of Helsinki, as revised in 2013.
CONSENT FOR PUBLICATION
Verbal informed consent was obtained from all participants, and written informed consent was obtained from parents/guardians before the start of the data collection.
AVAILABILITY OF DATA AND MATERIALS
The database is available on the ZENODO repository under the number 10.5281/zenodo.15738013
ACKNOWLEDGEMENTS
The authors would like to express their sincere gratitude to Inês Santos, José Atalaia, Pedro Pereira, and Marta Cameira, master's degree students in the Physical Education program at Institute Piaget of Almada, during the 2023/2024 academic year, for their invaluable assistance in collecting field data. Their dedication and contributions were essential to the successful completion of this study.