All published articles of this journal are available on ScienceDirect.

Inter-pitcher and Intra-pitcher Comparisons on the Relationship between Trunk Kinematics and Ball Speed in Collegiate Baseball Pitchers
Authors Info & Affiliations
Abstract
Introduction
The three-dimensional trunk movements are considered to play important roles in producing higher ball speed in baseball pitchers. However, the details on how the variations in trunk kinematics within an individual pitcher associate with ball speed are limited.
Methods
The purpose of this observational study was to examine the inter- and intra-pitcher relationship between ball speed and the three-dimensional trunk kinematics in sixteen male collegiate baseball pitchers (age; 20.0 ± 1.1 years, height; 1.77 ± 0.06 m, body mass; 78.0 ± 8.0 kg). Kinematic data of 10 maximum effort pitches were obtained for the correlation analyses with ball speeds. The inter-pitcher analysis included the mean values of each kinematic variable, while intra-pitcher analysis included all 10 pitches within each pitcher.
Results
: The inter-pitcher analysis showed a positive correlation between peak trunk throwing-arm side twist angle and ball speed (ρ = 0.64, p < 0.01, 90% confidence interval [0.24, 0.86]). This relationship was also observed for the intra-pitcher analysis in three pitchers; however, each intra-pitcher showed different patterns of correlational relationship between trunk kinematics and ball speed.
Discussion
The results indicated that the greater trunk throwing-arm side twist may be an important factor for both the group of pitchers and within an individual pitcher to throw with higher ball speed.
Conclusion
Inter- and intra-pitcher relationships between ball speed and the three-dimensional trunk kinematics were different, suggesting that the individuality should be considered along with the general tendency when the baseball pitchers modify their three-dimensional trunk mechanics.
1. INTRODUCTION
Ball speed is one of the most common indicators to evaluate the performance of baseball pitchers [1]. Pitching with higher ball speed requires well-coordinated movement of the body segments to generate and transfer mechanical energy to the throwing arm and ultimately to the ball [2].
In particular, trunk positioning and movement in all three planes of motion are considered to play important roles in accelerating the throwing arm and thereby producing higher ball speed [3]. Previous studies have reported significant associations between ball speed and three-dimensional trunk kinematics, including forward tilt in the sagittal plane, lateral tilt in the frontal plane, and separation in the transverse plane [4-9]. However, most of those studies have not included detailed information on how variations in trunk kinematics within an individual pitcher were associated with ball speed.
Trunk kinematics are thought to differ not only between pitchers but also within an individual pitcher [3]. To fully understand how trunk positioning and movement correlate with ball speed, intra-pitcher analysis must be performed. Although some previous studies used a mixed-model analysis to investigate the relationship between ball speed and trunk kinematics [3, 4, 9, 10], whether the inter-pitcher correlation can be applied to each pitcher remains unknown. Additionally, since the trunk rotation occurs three-dimensionally during pitching, there may be a potential reliance on the trunk kinematics in a single or multiple planes of motion within an individual pitcher. Such intra-pitcher reliance has been reported in studies of running [11, 12], but not in baseball pitching.
Therefore, the purpose of this study was to investigate the relationship between ball speed and trunk kinematics in all planes of motion during baseball pitching using intra- and inter-pitcher analyses. It was hypothesized that, in both inter- and intra-pitcher analyses, ball speed would correlate with peak trunk flexion angle, glove-side lateral bend angle, throwing-arm-side twist angle, and glove-side twist angular velocity, as reported in previous studies [4-9].
2. MATERIALS AND METHODS
2.1. Participants
This investigation utilized an observational study design and was conducted in August 2022. The recruitment of the participants began 4 weeks prior to the first day of measurement, and 16 male collegiate baseball pitchers participated in the measurement. Their mean age, height, and body mass were 20.0 ± 1.1 years, 1.77 ± 0.06 m, and 78.0 ± 8.0 kg, respectively. All participants completed a questionnaire regarding their anthropometrics and injury history. Inclusion criteria included no injury history of trunk and upper or lower extremity within a year prior to the measurement, and at least 3 years of experience in pitching primarily as a pitcher. None of the participants were excluded from this study due to an inability to participate, as they all met the criteria. All pitchers agreed to the terms and signed the informed consent before participating in the measurement. This study was approved by the Nippon Sport Science University Board of Ethics (021-H109).
2.2. Testing Protocol
The procedure was similar to that of the previous study [5], except that this study was conducted indoors rather than outdoors. After a sufficient self-preferred warm-up consisting of up to 10 min of dynamic mobility and submaximal throwing, the reflective markers were attached to pitchers’ bodies, either directly on their skin or on the surface of their tight spandex gear. Afterward, the pitchers were instructed to throw maximum-effort pitches with an intention to produce the highest ball speed possible from the stretch position to the catcher, 18.44 m away from the pitcher’s mound. A regular baseball weighing 0.145 kg (1BJBH10500, MIZUNO, Osaka, Japan), officialized by the Japan University Baseball Federation, was used for all trials. The pitchers continued their trials until ten valid pitch trials were obtained, defined as pitches caught in the strike zone and with all reflective markers tracked successfully. A standardized rest interval of 30 to 60 s was provided between pitches. Although fatigue level was assumed to be relatively low before and during the pitching trials, the pitchers were regularly asked whether they felt physically or mentally exhausted to the point where their maximal effort was compromised. The difference between the averages of the first and last five pitches was 0.14 km/h, confirming that no significant decline in performance occurred across trials.
2.3. Data Acquisition
A motion capture system with 12 cameras (Arqus 5, Qualisys Inc., Gothenburg, Sweden) captured the three-dimensional positions of each reflective marker, placed on 67 anatomical landmarks of each pitcher, in accordance with the International Society of Biomechanics recommendations [13, 14]. Marker trajectories were sampled at 250 Hz. The capture volume was calibrated prior to each session using a dynamic wand procedure. Ball speed was measured using a Speed Gun (1GJYM20100, MIZUNO, Osaka, Japan), similar to the previous study [15], and placed 3 m behind and in line with the catcher.
2.4. Data Processing
Time-series maker position data were filtered in all X, Y, and Z directions independently with a 13.4 Hz Butterworth low-pass filter [3, 16-18]. World and segmental coordinate systems were established based on the recommendations of the International Society of Biomechanics, except that the X-axis was directed laterally from left to right, the Y-axis was directed anteriorly, and the Z-axis was directed superiorly [13, 14, 19]. The segment angles were calculated using Euler’s equations of motion, with the rotation sequence of sagittal, frontal, and transverse corresponding to the XYZ sequence. For the purposes of this study, trunk angle was defined as the angle formed between the thorax and pelvis coordinate systems. Joint angular velocity was calculated as a derivative of the joint angle with respect to time. Trunk angle and angular velocity represent extension and flexion in the sagittal plane, throwing-arm side and glove side lateral bend in the frontal plane, and throwing-arm side and glove side twist in the transverse plane.
Maximum knee elevation, stride foot contact, and ball release were identified as previously described [3, 6, 20-22]. The pitching cycle was normalized from maximum knee elevation (0%) to ball release (100%).
2.5. Statistical Analysis
Mean ball speed and kinematic values of ten maximal-effort pitches per pitcher were calculated and used for inter-pitcher analysis, while those of all ten pitches per pitcher were used for each intra-pitcher analysis. Since the data was found to be deviated from the normal distribution, confirmed through the Shapiro-Wilk test, Spearman’s rank correlation coefficient (ρ) was calculated for the relationship between each peak kinematic value and ball speed during the pitching cycle. The correlation coefficient was interpreted as weak (<0.3), moderate (0.3-0.5), or strong (>0.5) per the recommendation of previous studies [23, 24]. In addition, a 90% confidence interval (90% CI) of the correlation coefficient was calculated based on the recommendations [24, 25] using the bootstrap method [11, 12], which provides 10,000 resamples of each kinematic value for intra-pitcher correlations. The coefficient was considered significant, and thus the kinematic reliance was identified if the lower limit of the 90% CI was greater than 0.1 or the upper limit was less than –0.1. All calculations were performed using MATLAB software R2021a (MathWorks, MA, USA).
3. RESULTS
The ball speed of all pitchers was 133.4 ± 5.7 km/h. The instant of stride foot contact occurred at 90.8 ± 2.5% in the pitching cycle. The extension angle reached its peak shortly after stride foot contact (92.9 ± 1.9%) and then decreased until the flexion angle reached its peak at ball release. The throwing-arm–side lateral bend angle peaked before stride foot contact (81.0 ± 7.5%), whereas the glove-side lateral bend angle increased toward ball release until it reached its peak value (98.5 ± 1.0%). The throwing-arm–side twist angle reached its peak right before stride foot contact (88.6 ± 3.2%) and then decreased to the point where the glove-side twist angle was at its peak (98.6 ± 1.0%). The result of inter-pitcher analysis is shown in Table 1. Only peak throwing-arm side twist angle showed a strong positive correlation with ball speed (ρ = 0.64, p < 0.01, 90% CI [0.26, 0.87]). Other angle variables and any of the angular velocity variables showed no correlation with ball speed.
The mean and standard deviation of the peak trunk angle and angular velocity for each pitcher are shown in Tables 2 and 3, respectively. The 90% CI of the correlation coefficient between ball speed and peak trunk angle and angular velocity for each intra-pitcher analysis is shown in Figs. (1A-F and 2A-F), respectively. A strong positive correlation was observed between peak trunk throwing-arm side twist angle in the transverse plane and ball speed in pitcher 2, 13, and 15 (ρ = 0.65, 90% CI [0.12, 0.88], p < 0.05; ρ = 0.62, 90% CI [0.15, 0.87], p = 0.06; ρ = 0.80, 90% CI [0.43, 0.95], p < 0.01, respectively; Fig. (1A-F). In addition, peak throwing-arm side twist angular velocities in pitcher 7 and 12 showed a strong positive correlations (ρ = 0.84, 90% CI [0.38, 0.98], p < 0.01; ρ = 0.72, 90% CI [0.39, 0.91], p < 0.05, respectively; Fig. (2A-F), and peak glove side twist angular velocity in pitcher 8 demonstrated a strong negative correlation (ρ = –0.91, 90% CI [–0.97, –0.82], p < 0.001) with ball speed.
| Variables | Mean ± SD (º) | ρ | 90% CI | Pitching Cycle (%) |
|---|---|---|---|---|
| Angle, deg | ||||
| Extension | 20.1 ± 5.9 | –0.23 | –0.58, 0.22 | 92.9 ± 1.9 |
| Flexion | –16.6 ± 7.4 | –0.18 | –0.59, 0.26 | 100.0 ± 0.0 |
| Throwing-arm side lateral bend | 10.8 ± 6.2 | 0.10 | –0.40, 0.58 | 81.0 ± 7.5 |
| Glove side lateral bend | –39.9 ± 8.4 | 0.03 | –0.42, 0.49 | 98.5 ± 1.0 |
| Throwing-arm side twist | 34.6 ± 6.9 | 0.64 | 0.26, 0.87 | 88.6 ± 3.2 |
| Glove side twist | –1.7 ± 8.8 | 0.43 | –0.00, 0.74 | 98.6 ± 1.0 |
| Angular velocity, deg/s | ||||
| Extension | 469.9 ± 137.2 | 0.06 | –0.35, 0.49 | 87.2 ± 3.7 |
| Flexion | –697.9 ± 109.8 | 0.01 | –0.43, 0.45 | 98.8 ± 0.9 |
| Throwing-arm side lateral bend | 96.5 ± 47.8 | –0.09 | –0.52, 0.37 | 76.4 ± 6.5 |
| Glove side lateral bend | –533.8 ± 123.1 | 0.01 | –0.46, 0.49 | 92.7 ± 3.1 |
| Throwing-arm side twist | 325.5 ± 102.0 | 0.39 | –0.06, 0.70 | 84.5 ± 4.6 |
| Glove side twist | –496.1 ± 104.0 | –0.34 | –0.71, 0.20 | 94.7 ± 1.9 |
Table 2.
| Pitcher | Sagittal Plane | Lateral Plane | Transverse Plane | |||
|---|---|---|---|---|---|---|
| Extension | Flexion | Throwing-arm Side | Glove Side | Throwing-arm Side | Glove Side | |
| #1 | 23.1 ± 0.9 | –23.4 ± 2.7 | 19.5 ± 1.0 | –43.8 ± 4.4 | 42.9 ± 0.7 | 9.8 ± 1.8 |
| #2 | 14.1 ± 0.7 | –21.0 ± 3.0 | 11.0 ± 0.8 | –38.4 ± 2.7 | 32.8 ± 0.6 | 4.9 ± 1.8 |
| #3 | 24.1 ± 1.5 | –12.9 ± 2.7 | 5.9 ± 1.0 | –53.3 ± 1.8 | 43.0 ± 0.6 | 2.8 ± 1.7 |
| #4 | 12.7 ± 0.9 | –20.7 ± 9.7 | 16.4 ± 0.4 | –29.3 ± 5.0 | 44.0 ± 0.6 | –0.9 ± 8.4 |
| #5 | 10.3 ± 1.2 | –11.8 ± 1.6 | 16.2 ± 1.6 | –38.0 ± 1.8 | 39.5 ± 0.6 | –5.0 ± 1.3 |
| #6 | 28.5 ± 1.1 | –0.5 ± 1.6 | 3.5 ± 1.4 | –30.3 ± 1.6 | 32.7 ± 1.5 | –8.3 ± 1.0 |
| #7 | 22.7 ± 1.8 | –20.1 ± 3.3 | 7.5 ± 1.4 | –45.2 ± 1.6 | 42.3 ± 0.8 | 2.4 ± 1.1 |
| #8 | 20.6 ± 1.2 | –8.3 ± 2.5 | 5.5 ± 1.1 | –31.4 ± 1.9 | 25.1 ± 0.6 | –21.4 ± 0.7 |
| #9 | 11.4 ± 0.6 | –29.1 ± 2.1 | 4.8 ± 1.0 | –37.2 ± 1.8 | 33.4 ± 0.8 | 12.5 ± 1.1 |
| #10 | 21.4 ± 1.2 | –18.6 ± 1.4 | 11.4 ± 1.1 | –35.8 ± 1.5 | 35.1 ± 0.6 | –3.3 ± 1.4 |
| #11 | 21.4 ± 0.9 | –16.4 ± 1.7 | 11.9 ± 0.8 | –48.5 ± 1.5 | 31.4 ± 0.7 | 1.5 ± 1.6 |
| #12 | 27.2 ± 1.0 | –27.0 ± 7.4 | 19.2 ± 0.7 | –52.6 ± 4.0 | 41.9 ± 0.6 | 10.7 ± 4.2 |
| #13 | 24.7 ± 1.3 | –8.9 ± 2.3 | 7.6 ± 0.7 | –30.7 ± 1.3 | 35.1 ± 1.4 | –7.8 ± 1.9 |
| #14 | 10.7 ± 1.7 | –23.2 ± 2.9 | 18.7 ± 2.4 | –30.8 ± 3.6 | 27.1 ± 1.1 | –13.8 ± 1.2 |
| #15 | 24.0 ± 2.6 | –11.5 ± 3.1 | 13.5 ± 0.9 | –41.4 ± 1.3 | 25.2 ± 0.9 | –5.2 ± 1.7 |
| #16 | 24.4 ± 1.2 | –11.9 ± 2.3 | –0.5 ± 1.2 | –51.5 ± 2.2 | 22.6 ± 1.0 | –5.8 ± 2.0 |
| Pitcher | Sagittal Plane | Frontal Plane | Transverse Plane | |||
|---|---|---|---|---|---|---|
| Extension | Flexion | Throwing-arm Side | Glove Side | Throwing-arm Side | Glove Side | |
| #1 | 675.1 ± 28.6 | –759.2 ± 100.9 | 71.9 ± 9.0 | –629.1 ± 50.5 | 366.0 ± 19.6 | –498.1 ± 42.3 |
| #2 | 412.5 ± 20.1 | –546.3 ± 140.2 | 156.0 ± 16.1 | –484.4 ± 17.3 | 329.8 ± 14.5 | –331.2 ± 30.8 |
| #3 | 441.8 ± 25.2 | –800.2 ± 45.1 | 35.0 ± 23.9 | –590.8 ± 31.1 | 376.6 ± 12.2 | –621.6 ± 19.8 |
| #4 | 439.2 ± 22.9 | –731.0 ± 162.9 | 106.2 ± 11.6 | –500.3 ± 24.5 | 543.7 ± 21.1 | –560.9 ± 95.4 |
| #5 | 224.5 ± 14.1 | –475.7 ± 40.5 | 46.3 ± 11.4 | –457.8 ± 18.2 | 284.1 ± 15.4 | –549.9 ± 30.4 |
| #6 | 649.1 ± 35.3 | –732.0 ± 77.6 | 110.9 ± 11.5 | –369.4 ± 55.7 | 268.8 ± 29.9 | –560.5 ± 36.9 |
| #7 | 517.2 ± 26.1 | –837.4 ± 89.8 | 76.6 ± 11.1 | –586.1 ± 22.5 | 404.7 ± 27.2 | –541.3 ± 48.2 |
| #8 | 495.2 ± 25.8 | –653.8 ± 59.6 | 109.4 ± 7.7 | –441.8 ± 18.6 | 248.3 ± 14.2 | –699.1 ± 32.4 |
| #9 | 282.2 ± 23.2 | –656.9 ± 28.8 | 54.2 ± 7.0 | –498.8 ± 35.3 | 178.6 ± 14.1 | –306.6 ± 10.7 |
| #10 | 360.6 ± 15.5 | –619.9 ± 34.6 | 143.8 ± 17.2 | –476.6 ± 22.9 | 309.9 ± 21.6 | –569.7 ± 25.5 |
| #11 | 671.1 ± 23.0 | –637.6 ± 31.1 | 221.8 ± 17.7 | –605.2 ± 23.4 | 443.7 ± 24.5 | –443.8 ± 17.3 |
| #12 | 693.0 ± 13.0 | –924.2 ± 115.9 | 85.6 ± 16.3 | –699.0 ± 39.0 | 456.9 ± 13.3 | –507.7 ± 42.0 |
| #13 | 355.4 ± 17.6 | –818.1 ± 81.7 | 62.5 ± 16.8 | –354.3 ± 50.0 | 293.4 ± 27.6 | –539.0 ± 39.9 |
| #14 | 448.3 ± 23.1 | –633.1 ± 64.3 | 118.0 ± 23.9 | –444.1 ± 22.4 | 305.2 ± 19.0 | –442.1 ± 48.5 |
| #15 | 380.2 ± 12.4 | –671.4 ± 30.5 | 86.9 ± 10.6 | –570.5 ± 39.8 | 211.0 ± 17.2 | –358.3 ± 17.2 |
| #16 | 472.3 ± 15.1 | –670.2 ± 48.7 | 59.3 ± 13.5 | –831.9 ± 39.4 | 186.5 ± 9.9 | –408.4 ± 36.2 |
In the sagittal plane, intra-pitcher analysis revealed a strong positive correlation between peak trunk extension angle and ball speed in pitcher 9 (ρ = 0.67, 90% CI [0.14, 0.89], p < 0.05). In addition, peak extension angular velocity was strongly and positively correlated with ball speed in pitcher 8 (ρ = 0.84, 90% CI [0.54, 0.94], p < 0.05) and negatively in pitcher 9 (ρ = –0.65, 90% CI [–0.84, –0.10], p < 0.05). Peak flexion angular velocity showed a strong positive correlation with ball speed in pitcher 15 (ρ = 0.64, 90% CI [0.12, 0.93], p < 0.05).
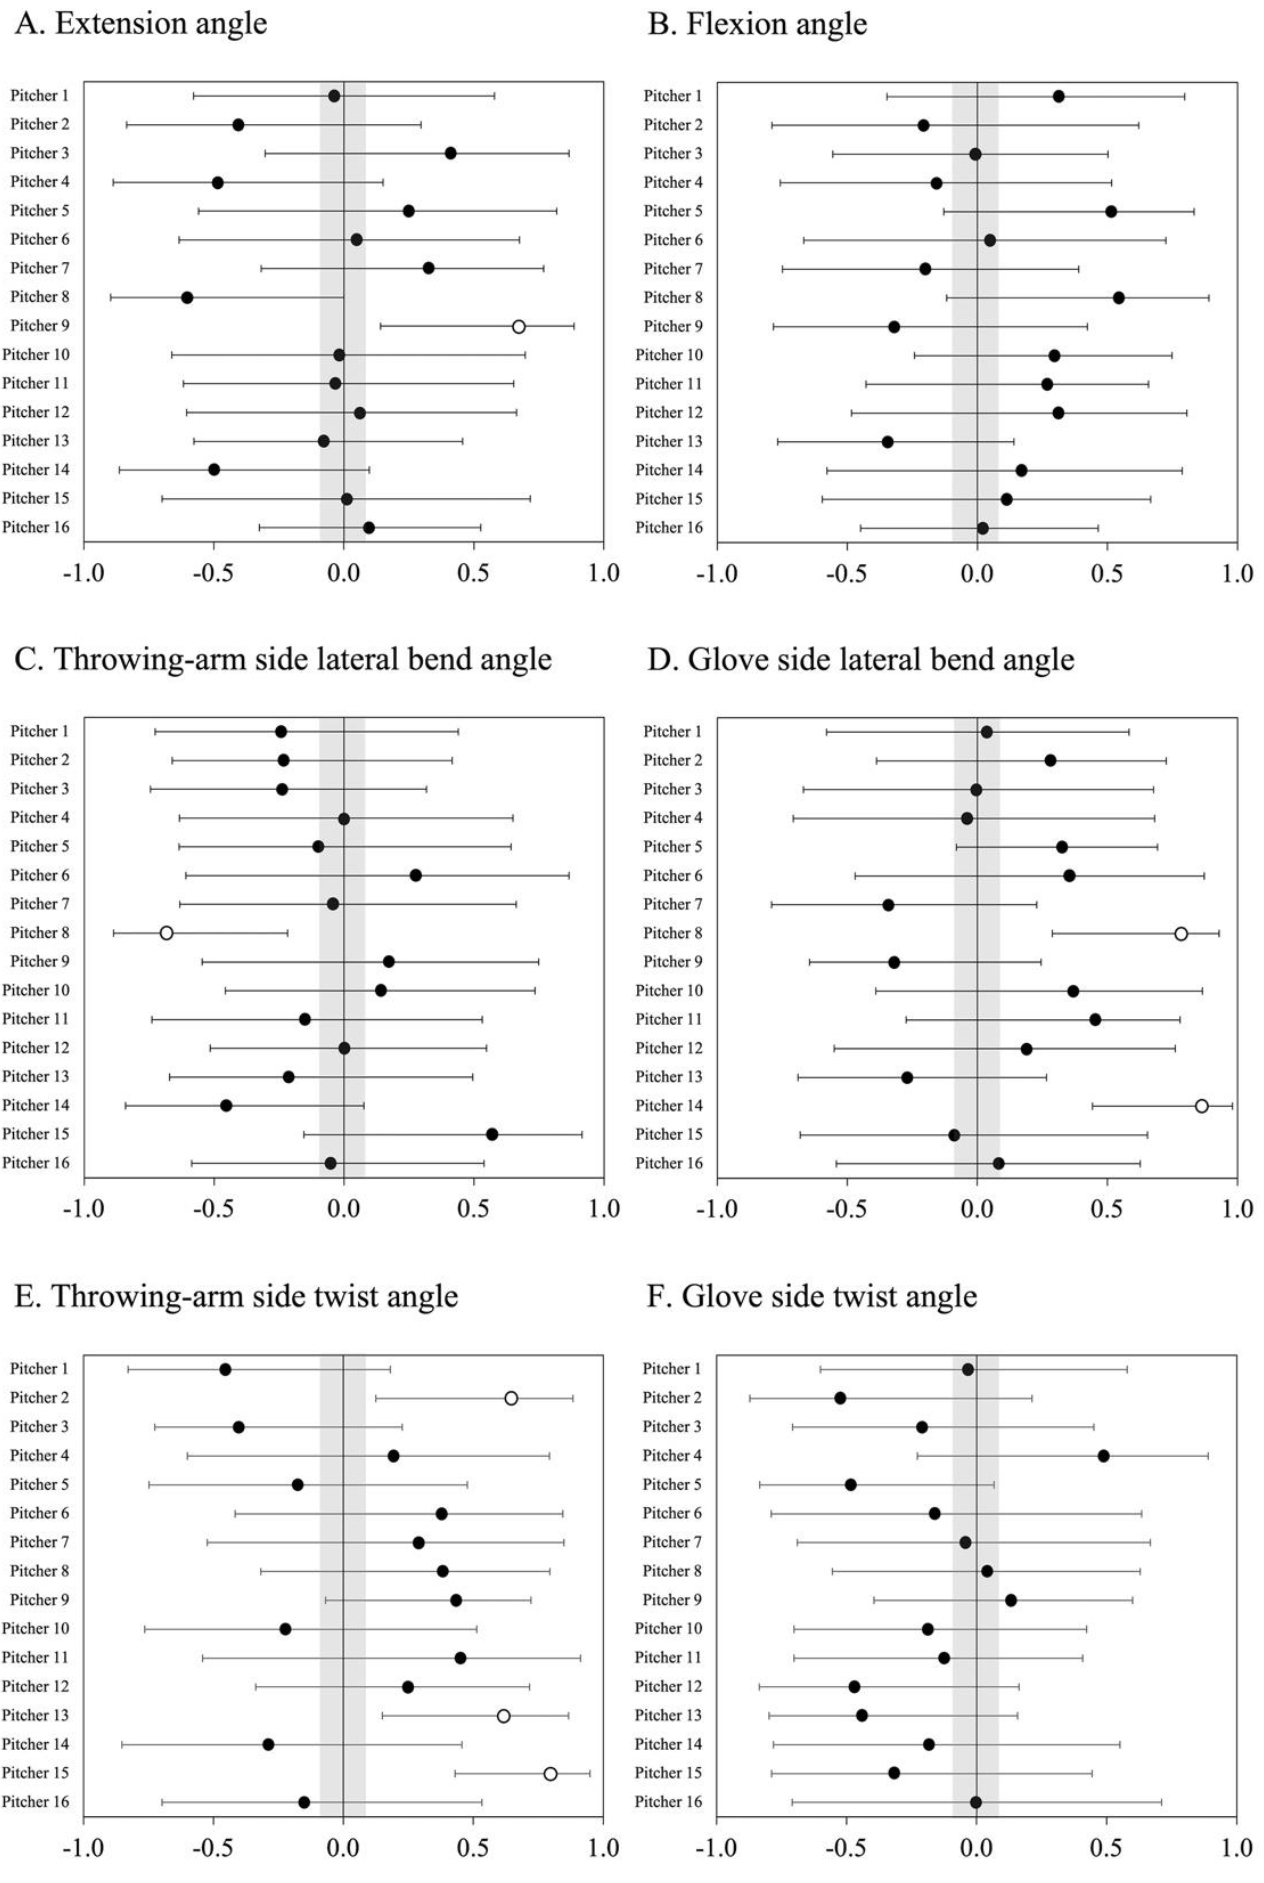
(A-F) Correlation coefficient and its 90% CI range for the relationship between ball speed and peak trunk angles of each pitcher. Each pitcher is listed on the y-axis, and correlation coefficients are on the x-axis. White circles indicate the significant correlation with ball speed (either the lower limit of 90% CI of the correlation coefficient is greater than 0.1, or the upper limit of the correlation coefficient is less than –0.1, as the gray area represents the range from –0.1 to 0.1), and black circles indicate no significant correlation. The width of the horizontal bars outside the white/black circles represents the range of the 90% CI. To avoid any misinterpretation regarding signs, all coefficients of variables with negative values (B, D, and F) were shown as positive (i.e., for pitcher 8, the greater the glove side lateral bend angle was, the higher the ball speed was).

(A-F) Correlation coefficient and its 90% CI range for the relationship between ball speed and peak trunk angular velocity of each pitcher. Each pitcher is listed on the y-axis, and correlation coefficients are on the x-axis. White circle indicates the significant correlation with ball speed (either the lower limit of 90% CI of the correlation coefficient is greater than 0.1, or the upper limit of the correlation coefficient is less than –0.1, as the gray area represents the range from –0.1 to 0.1), and black circles indicate no significant correlation. The width of the horizontal bars outside the white/black circles represents the range of the 90% CI. To avoid any misinterpretation regarding signs, all coefficients of variables with negative values (B, D, and F) were shown as positive (i.e., for pitchers 3 and 14, the higher the glove side lateral bend angular velocity was, the higher the ball speed was).
In the frontal plane, intra-pitcher analysis showed a strong negative correlation between peak trunk throwing-arm side lateral bend angle and ball speed in pitcher 8 (ρ = –0.68, 90% CI [–0.89, –0.22], p < 0.05). Peak glove side lateral bend angle was strongly and negatively correlated with ball speed in pitchers 8 and 14 (ρ = –0.78, 90% CI [–0.93, –0.29], p < 0.01; ρ = –0.86, 90% CI [–0.98, –0.44], p < 0.01, respectively). The results also showed strong positive correlations between peak throwing-arm side lateral bend angular velocity and ball speed in pitcher 3, 5 and 7 (ρ = 0.92, 90% CI [0.82, 1.00], p < 0.01; ρ = 0.71, 90% CI [0.28, 0.93], p < 0.05; ρ = 0.65, 90% CI [0.10, 0.91], p < 0.05, respectively). Peak glove side lateral bend angular velocity was strongly and negatively correlated with ball speed in pitchers 3 and 14 (ρ = –0.78, 90% CI [–0.96, –0.42], p < 0.01; ρ = –0.82, 90% CI [–0.56, –0.98], p < 0.01, respectively).
4. DISCUSSION
4.1. Trunk Movement in the Transverse Plane and Ball Speed
In inter-pitcher analysis, peak trunk throwing-arm side twist angle was correlated with ball speed. Greater trunk separation angle (‘trunk throwing-arm side twist angle’ in this study) near stride foot contact has been reported as a characteristic of the pitchers with higher ball speeds [5-7, 26]. In this study, the trunk throwing-arm side twist angle reached its peak shortly before the instant of stride foot contact, similarly to the previous report [27]. Therefore, it is possible to assume that pitchers with higher ball speeds increased the rotational difference between the thorax and pelvis in the transverse plane before the stride toward the throwing direction ended, which agrees with the findings of the aforementioned studies. However, other variables previously reported to be correlated with ball speed, such as flexion or lateral bend [8-10], did not show significant correlations in this study. Thus, the importance of trunk twist in the transverse plane may be greater than that of movements in the sagittal or frontal planes, and it should be emphasized when collegiate pitchers attempt to increase ball speed by modifying trunk mechanics. In intra-pitcher analysis, a positive correlation between ball speed and peak trunk throwing-arm side twist angle or angle velocity was also observed for pitchers 2, 7, 13, and 15. This indicates that achieving greater and faster trunk twist in the opposite direction of pitching would increase ball speed in these individuals, supporting the previous finding [28]. Greater trunk separation enables pitchers to enhance the “serape effect” of the trunk, in which the stored elastic energy in the stretched core and hip musculature, generated by separating the thorax and pelvis segments, is transferred into the throwing arm and ball [6]. Pitchers who rely on rotational kinematics in the transverse plane are referred to as “transverse plane reliant” when characterizing their fastball pitching. Pitchers 1 and 3, however, showed a nonsignificant correlation between ball speed and peak trunk throwing-arm-side twist angle within themselves, although these pitchers had the first- and third-highest mean ball speeds. In the previous study, achieving greater than 25º of trunk separation angle at stride foot contact was suggested as the proper mechanics producing higher ball speeds [5]. Since pitchers 1 and 3 achieved nearly 43º of peak throwing-arm side twist angle, which was greater than those of pitchers 2, 13, and 15, ranging from 25º to 35º (Table 2), it can be assumed that the pitchers with peak throwing-arm side twist angles of over 40º might no longer benefit from further increase.
4.2. Trunk Movement in the Sagittal Plane and Ball Speed
In addition to trunk twist, pitcher 15 showed that lower peak flexion angular velocity was correlated with higher ball speeds. This contradicts the previous finding [10], which reported a positive correlation between ball speed and thorax flexion angle at the instant of ball release. The possible explanation for this inconsistency may be that pitcher 15 attempted to maintain an upright posture until ball release, which is considered a proper posture that improves performance [8, 10]. Therefore, modifying trunk movement in the sagittal plane, as previous studies suggested, may not be beneficial for pitcher 15 when attempting to increase ball speed. Pitcher 9 showed positive and negative correlations between peak trunk extension angle and angular velocity with ball speed, respectively. Intra-pitcher analysis suggests that this pitcher may benefit from obtaining a greater peak extension angle while reducing its peak angular velocity. Thorax staying back relative to the pelvis can help with traveling over longer distances and accelerate toward the throwing direction later in the pitching cycle. Those pitchers with either positive or negative correlation between ball speed and the rotation in the sagittal plane can be referred to as “sagittal plane reliant” of fastball pitching.
4.3. Trunk Movement in the Frontal Plane and Ball Speed
Intra-pitcher analysis showed some correlations between ball speeds and peak lateral bending variables in pitchers 3, 5, 7, 8, and 14. Pitchers 8 and 14 threw with higher ball speed when the peak glove side lateral bend angle was greater. Previous studies reported that pitchers with higher ball speed tended to have greater trunk lateral tilt angles at the instant of maximum shoulder external rotation or ball release [8, 9, 29]. Increasing the distance between the trunk's axis of rotation and the throwing arm by leaning more toward the glove side might help accelerate the throwing arm [9]. On the contrary, pitchers 3, 5, and 7 threw with higher ball speeds when the lateral bend angular velocity to the throwing-arm side was higher. These findings may indicate that a faster countermovement of the trunk laterally toward the throwing-arm side before stride foot contact helped these pitchers maximize the stretch-shortening effect of the abdominal muscle-tendon units to accelerate the trunk into the throwing direction. These pitchers can be referred to as “lateral plane reliant” of fastball pitching.
4.4. Interpretation of Inter- and Intra-pitcher Correlations
The results of inter- and intra-pitcher analyses in this study together can be interpreted as such that trunk throwing-arm side twist may have an optimal range that affects the production of ball speed, whereas trunk lateral bend and its correlation with ball speed may be highly dependent on the unique kinematics of each individual pitcher rather than the particular pitching styles. The previous study reported that ball speeds were not significantly different among pitchers with different contralateral trunk tilt angles [30], suggesting that variation in trunk lateral bend may affect ball speed more within an individual pitcher. As such, considering intra-pitcher reliance, along with the overall tendency driven by inter-pitcher analysis, helps pitchers increase ball speed by modifying trunk movement.
In this study, trunk kinematic reliance classifications were based solely on the relationship between ball speed and peak values. To better understand the reliance in each individual pitcher, temporal or sequential kinematic data needs to be analyzed throughout the entire pitching cycle. In addition, a larger sample size could have helped achieve adequate power to detect moderate or weak intra-pitcher correlations when interpreting the results of this study. Future research is required to confirm the findings and suggestions of this study using a larger sample and a wider range of the population, from youth to professional baseball pitchers.
CONCLUSION
In conclusion, the inter- and intra-pitcher correlations and reliance between trunk kinematics and ball speed were different in collegiate baseball pitchers. The inter- and intra-pitcher correlations between ball speed and peak trunk throwing-arm side twist angle were observed, indicating that trunk twist near stride foot contact may be a common factor that was related to the produced ball speed for both a group of pitchers and an individual pitcher. However, the variation in intra-pitcher correlations and reliance suggests that individual variability, along with the general tendency, should be considered when modifying trunk positioning or movement within an individual to produce higher ball speed.
AUTHORS’ CONTRIBUTIONS
The authors confirm their contributions to the paper as follows: N.W. and T.N.: Study conception and design; T.T. and T.K.: Data collection; M.O.: Drafted the manuscript; T.K.: Conceptualization; Y.Y.: Methodology. All authors reviewed the results and approved the final version of the manuscript.
ABBREVIATION
| 90% CI | = 90% confidence interval |
ETHICS APPROVAL AND CONSENT TO PARTICIPATE
Nippon Sport Science University, Japan Board of Ethics (021-H109) approved this study.
HUMAN AND ANIMAL RIGHTS
All procedures performed in studies involving human participants were in accordance with the ethical standards of institutional and/or research committee and with the 1975 Declaration of Helsinki, as revised in 2013.
AVAILABILITY OF DATA AND MATERIALS
The data supporting the findings of the article is available in the ZENODO repository under the number 10.5281/zenodo.17502528.
ACKNOWLEDGEMENTS
Declared none.