All published articles of this journal are available on ScienceDirect.

Different Smoothing Window Lengths can Estimate the Neuromuscular Fatigue Threshold at The same Intensity of the Lactate Threshold During the Leg Press Exercise
Authors Info & Affiliations
Abstract
Background:
This study aimed to compare different smoothing window lengths used to compute the RMS and their impact on RMS slope during leg press exercise and to compare the RMS slope behavior with lactate threshold.
Methods:
Twelve subjects performed an incremental test on a leg press machine where blood lactate concentration was measured at each stage. The RMS of vastus medialis (VM), vastus lateralis (VL) and rectus femuralis (RF) were computed for 200, 1500 and 3000ms windows length periods, and the RMS linear slope was used to interpret the results in the amplitude domain. The EMG fatigue threshold (EMGth) was determined for the quadriceps muscle during the three smoothing window lengths.
Results:
There was no significant difference (p> 0.05) in RMS slope between the three different RMS window length analyses for VM and VL muscles. The RMS slope was significantly higher (p ≤ 0.05) for the window length period of 1500 and 3000ms compared to 200ms in some intensities of exercise. The ICCs between the RMS slopes were 0.94 for RF and 0.95 for VL and VM. There was no significant difference (p> 0.05) between the EMGth at different window length periods and the lactate threshold (28.0 ± 3.7% of 1RM).
Conclusion:
Different smoothing window lengths to computed RMS could be used during resistance exercise without differences in RMS slope. The smoothing window lengths don´t influence EMGth intensity and are related to the lactate threshold.
1. INTRODUCTION
Surface electromyography (EMG) is a valuable noninvasive tool in the study of human movement and neurophysiologic mechanisms of fatigue that is usually evaluated during sustained, constant-force contractions in one posture isometric contractions. Nevertheless, isometric contractions may not be representative of muscle activity and fatigue development during usual physical activity in humans, such as resistance exercise.
Although dynamic muscle actions are much more common in sports rather than isometric muscle actions, they present some challenges when processing the resulting EMG signals [1]. The most important challenge results from the fact that the signal can be non-stationary because of the movement of the muscle fibers beneath the recording electrodes, changes in fiber length, and alterations in the number of active motor units and their firing rates [1, 2]. These factors are often negligible during static contractions but can substantially complicate our interpretation of the EMG signal during the movement [1]. In this way, methods that allow reliable assessment of dynamic contractions are of great importance for studying human muscle function and motor control as well as for sports and clinical practice.
The root mean square (RMS) turned out to be the most sensible and reliable parameter of signal amplitude of the EMG, as it is not affected by the cancellation due to the motor unit action potential train superposition [3]. However, the behavior of RMS during dynamic contractions may be influenced by geometrical factors, which could lead to high signal variability [1, 4]. Variance of the estimate can be considerably reduced with special techniques, such as signal whitening and smoothing process [5].
The characteristics of resistance exercise;repetitive isotonic contractions with concentric and eccentric muscle activity where joint-angle vary with time, causes the non-stationary nature of the EMG and increased variability in EMG parameters over time [1, 6]. Thus, a robust analysis must detect the long-term changes in the EMG while remaining insensitive to the short-term alterations caused by dynamic factors. Because EMG amplitude changes during the contraction, an appropriate smoothing window length over which the signal is quasi-stationary must be selected [7, 8]. A classical review study [9] describes that the signal smoothing technique may have profound effects on the validity of EMG amplitude, yet, they do not present scientific recommendations for window lengths. Furthermore, the rate of rise in EMG amplitude as a function of time (slope coefficient), previously suggested in 1982 [10] can be used to analyze the EMG pattern during different bouts of resistance exercise.
Considering the repetitive isotonic contractions of resistance exercise at different intensities, there are several justifications to use different window lengths based on the concentric and eccentric phase times or total repetition time. Moreover, astrong physiological link between myoelectrical changes and the transition from aerobic to anaerobic metabolism during the exercise, called anaerobic threshold [11,12] was suggested, even during resistance exercise [13-16]. On the basis of these facts, the objectives of this study were: (1) to compare different smoothing window lengths used to compute the RMS and their impact on RMS slope; (2) identify a reliable and noninvasive way to estimate the onset of fatigue during incremental resistance exercise and (3) to compare the RMS slope behavior with lactate threshold.
2. METHODS
2.1. Subjects
Twelve healthy men (mean ± SD age 26 ± 3 years; height 181 ± 7 cm; body mass 82.3 ± 7.3 kg; BMI 25.2 ± 1.7 kg/m2) participated in the study. The sample size was calculated using GPower Software using alpha error of 0.05, power 0.80 and correlation between factors of 0.7 after a pilot study. Subjects had a minimum experience of 6 months in hypertrophy-type resistance training, with the typical load corresponding to 6–12 RM. The participants also answered the Physical Activity Readiness Questionnaire [17]. The following exclusion criteria were adopted: (1) use of any kind of medication or anabolic steroids; (2) cardiovascular, metabolic, neurological, pulmonary or orthopedic complications that could limit the performance of the exercise. The experiments were carried out in a climatically controlled room at 22-24 °C with a relative air humidity of 50-60%. Each subject was instructed to avoid caffeinated and alcoholic beverages and other stimulants the night before and on the day of the data collection. Subjects were also instructed not to perform activities requiring moderate to heavy physical exertion the day prior to the application of the protocols. This study was approved by our Institutional Research Ethics Committee (#494.2009) and has been conducted according to the principles expressed in the Declaration of Helsinki. The procedure was explained to each subject separately, and they signed informed consent forms.
2.2. Experimental Design
The subjects accomplished two sessions of exercise in the morning and on different days. In the first session, 1RM was determined. After 48h, each subject performed an incremental test on one leg press machine where blood lactate concentration was measured at each stage. The EMG of three quadriceps muscles was continuously recorded and the RMS contained in three different fixed window lengths was analyzed.
All tests were performed on a leg press (Leg Press 45°, Reforce, Brazil) machine. The subjects were instructed to perform the correct biomechanics of the movement in all sessions, which included: (1) each repetition cycle lasted about 3 s, with 1.5 s for the concentric phase and 1.5 s for the eccentric phase, controlled by visual and verbal commands; (2) motion angle of the knee between 90 and 180 degrees, controlled by an electrogoniometer (EMG system, Brazil).
2.2.1. One-repetition Maximum Test
Subjects performed a 1RM test on a leg press [18]. Initially, the resistance load for 1RM was estimated before the test by multiplying the body weight of the volunteer by four, based on previous pilot tests and perceived maximum strength. A warm-up set of 7 to 10 repetitions was performed using 50% of the resistance load for an estimated 1RM. After a 1-min rest period, a set of 3 to 5 repetitions was performed at 80% of the resistance load for estimated 1RM. Subsequently, 3 to 4 maximum trials (one-repetition sets) were performed to determine the 1RM strength. The rate of a gradual increase in load was dependent on the participant’s self-perceived capacity. When the pre-1 RM was determined, a second attempt with an additional 10% above the load was performed to verify the load value and in cases where the individual was not successful on this second trial, the previous load was considered as his 1 RM. Nevertheless, if the volunteer was successful, a new load was added until the 1RM was determined. Based on the estimated loads of 1RM, it was expected that 1RM would be determined in up to 6 trials, with a 5-min period between the trials.
2.2.2. Resistance Incremental Test
The selected intensities during the resistance incremental test were 10, 20, 25, 30, 35 and 40% of 1 RM. Consequently, the incremental load adjustment was 10% of 1 RM until exhaustion. This division of intensities was chosen due to previous studies demonstrating that the anaerobic threshold intensity in resistance exercise is around 30% of 1 RM13–16. Each stage lasted 1 min, and the subjects performed 20 repetitions, with each repetition lasting about 3 s. Passive recovery between stages lasted 2 min. The end of the test was determined either by the subject’s incapacity to perform the movement within the previously established correct biomechanics or by the inability to achieve the number of repetitions established for the stage.
Blood samples (25 μl) were collected from the earlobe at rest and 30 s after the end of each stage of the resistance incremental test [19]. Blood lactate concentration was determined by electro enzymatic method (1500 Sport, Yellow Springs Instruments Inc., USA). The lactate threshold was defined as the intensity where blood lactate concentration begins to increase in an exponential manner, identified by the algorithmic adjustment method [14]. A computerized 2-segment regression analysis was briefly performed to locate the intersection point of the segments in the blood lactate concentration versus workload. The two linear regression equations were set equal to each other and solved for x, the work rate at the lactate threshold. All data were treated using Matlab version 7.4 (MathWorks, Natick, MA, USA).
2.2.3. EMG Electrode Placement and Instrumentation
During the incremental test, EMG activity was continuously recorded from quadriceps muscles: vastus medialis (VM), vastus lateralis (VL) and rectus femuralis (RF). A pair of surface electrodes (Universal Ag/AgCl electrodes, HAL, São Paulo, SP, Brazil) was attached to the skin with a 20 mm inter-electrode distance. The electrodes were placed longitudinally in respect to the underlying muscle fiber arrangement and with the recommendations of the International Society of Electrophysiology and Kinesiology [20]. Prior to the electrode application, the skin was shaved and abraded using sandpaper and cleaned with alcohol in order to minimize the impedance. The wires connected to the electrodes were well secured with tape to avoid artifacts from leg movements.
Myoelectric activity was recorded using an 8-channel module EMG analyzer (EMG800C, EMG System do Brazil, São José dos Campos, SP, Brazil) consisting of conditioner with a band pass filter with cut-off frequencies at 20–500Hz, an amplifier gain of 1000 and a common mode rejection ratio (CMRR) >120dB and input-referred noise level of 3μV RMS. All data was acquired and processed using a 16-bit Analog to Digital (A/D) converter (EMG System do Brazil, São José dos Campos, SP, Brazil) with a sampling frequency 1 kHz.
2.2.4. EMG Analyses
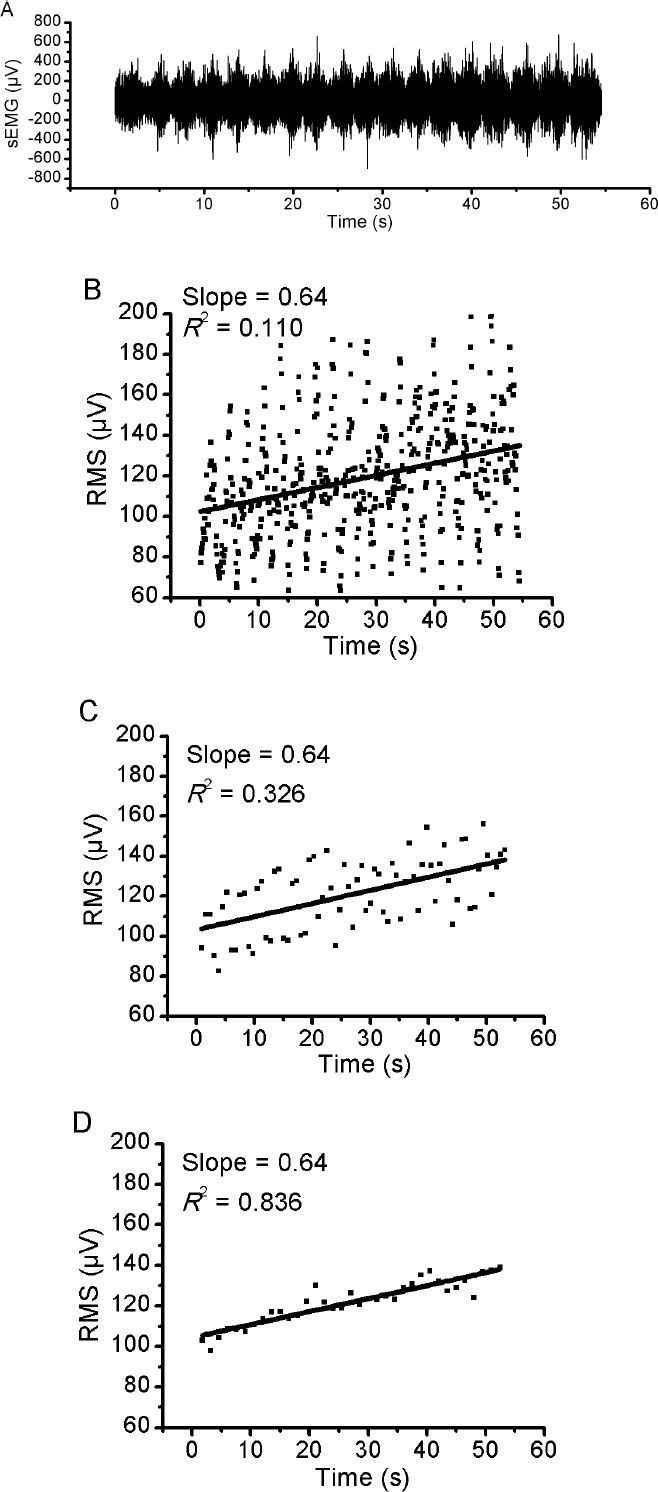
The EMG signal was analyzed by using the Matlab software version 7.4 (MathWorks, Natick, MA, USA). The EMG recording during the recovery period was excluded from de analyses. An EMG amplitude was computed for three different analyses at fixed window lengths throughout the test: (1) 200 ms with an overlapping of 100 ms, (2) 1500 ms with overlapping of 750 ms and (3) 3000 ms with overlapping of 1500 ms. The root mean square (RMS) voltage enclosed in each 200 ms spectrum was calculated (in μV), equally in 1500 ms and in 3000 ms. These window lengths were chosen to represent the time course of one repetition cycle (3000 ms), time course of one concentric or eccentric phase (1500 ms) and a shorter period than each phase (200 ms). The RMS data was calculated for each window length, muscle and subject. The first and the last repetition cycles were excluded from the analyses to prevent unwanted factors corresponding to the beginning and the end of each workload.
Then, the rates of rise in RMS values (RMS slope) were used to interpret the results in the amplitude domain. The RMS slope was determined for VM, VL and RF muscles during the incremental test for all performance test analyses and for each exercise´s intensity. The RMS slope was determined using a straight regression line in RMS values during the different intensities of the resistance incremental test. In a typically linear regression equation (y = ax + b), the slope corresponds to the “a” value.The RMS slope was used to minimize the limitations of using RMS to assess relative muscle activation during dynamic contractions.
2.2.5. Investigation of the EMG Fatigue Threshold during Incremental Resistance Exercise
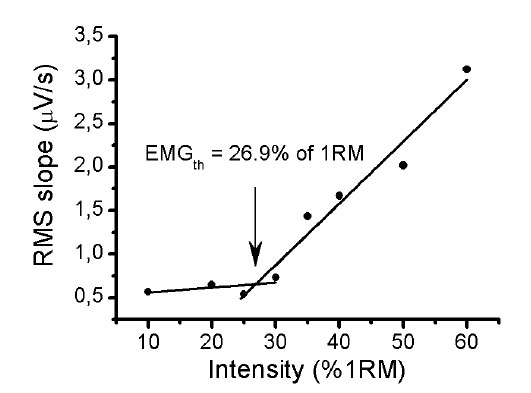
The RMS of the quadriceps muscle group was considered as the sum of the RMS of VM, VL and RF muscles [21, 22]. Then, the RMS slope values were plotted over the intensities of the resistance incremental exercise in order to explore a pattern in behavior of the RMS slope during the exercise, based on the anaerobic threshold, previously established in resistance exercise. A piecewise linear regression model was performed to locate the intersection point of the segments in the RSM slope versus workload. The two (one for the lower component, the other for the upper component) were set equal to each other and solved for x, which we define as the EMG fatigue threshold (EMGth).
| Intensity (%1RM) | VM | VL | RF |
|---|---|---|---|
| 10 | 0.91 (0.78 – 0.97) | 0.98 (0.93 – 0.99) | 0.96 (0.91 – 0.99) |
| 20 | 0.98 (0.95 – 0.99) | 0.94 (0.85 – 0.98) | 0.85 (0.67 – 0.95) |
| 25 | 0.95 (0.88 – 0.98) | 0.95 (0.88 – 0.98) | 0.99 (0.97 – 0.99) |
| 30 | 0.91 (0.78 – 0.97) | 0.89 (0.74 – 0.96) | 0.96 (0.89 – 0.99) |
| 35 | 0.98 (0.94 – 0.99) | 0.97 (0.92 – 0.99) | 0.96 (0.87 – 0.99) |
| 40 | 0.97 (0.92 – 0.99) | 0.96 (0.90 – 0.99) | 0.95 (0.81 – 0.98) |
| 50 | 0.96 (0.90 – 0.99) | 0.96 (0.90 – 0.99) | 0.87 (0.65 – 0.96) |
| 60 | 0.95 (0.88 – 0.99) | 0.96 (0.90 – 0.99) | 0.94 (0.83 – 0.98) |
| Mean ± DP | 0.95 ± 0.93 | 0.95 ± 0.03 | 0.94 ± 0.04 |
2.3. Statistical Analyses
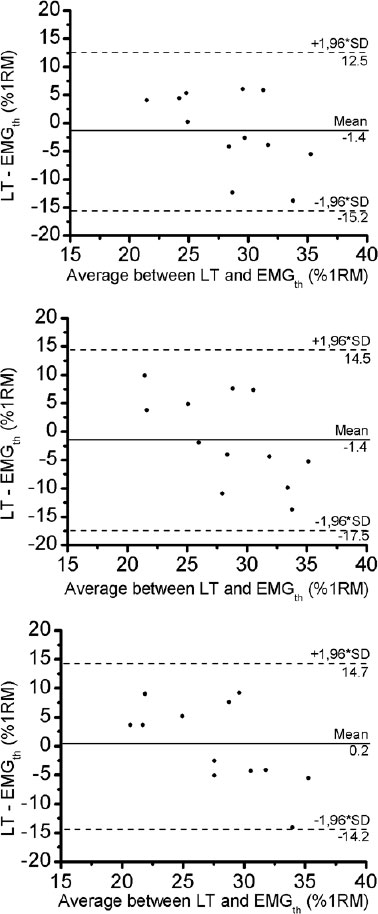
Results are expressed as means ± SD. The statistical analysis was done by the Shapiro-Wilk normality test. All variables analyzed presented normal distribution. ANOVA with repeated measures was used to compare the RMS slope values and the EMGth between the three different window lengths analyses. Compound sphericity was verified by the Mauchley test. When the assumption of sphericity was not met, the significance of F-ratios was adjusted according to the Greenhouse-Geisser procedure. Tukey’s post-hoc test with the Bonferroni adjustment was applied in the event of significance. The reliability between RMS slope values was evaluated using Intraclass Correlation Coefficient (ICC). Paired t-test was used to compare lactate threshold and EMGth. The agreement between the two was confirmed using the Bland and Altman method [23]. The level of significance was p < 0.05 and SPSS version 17.0 (Somers, NY, USA) software was used.
| - | 200ms | 1500ms | 3000ms |
|---|---|---|---|
| RF | 0.045 (0.032 – 0,058) | 0,122 (0,090 – 0,153) | 0.339 (0.278 – 0.399) |
| VM | 0.036 (0.024 – 0.048) | 0.092 (0.071 – 0.112) | 0.386 (0.330 – 0.442) |
| VL | 0.034 (0.026 – 0.042) | 0.093 (0.072 – 0.114) | 0.379 (0.322 – 0.436) |
3. RESULTS
The mean ± DP of the 1RM was 287.3 ± 30.4 kg and the maximal intensity achieved during the incremental test was 6/.3 ± 9.4% of 1RM.
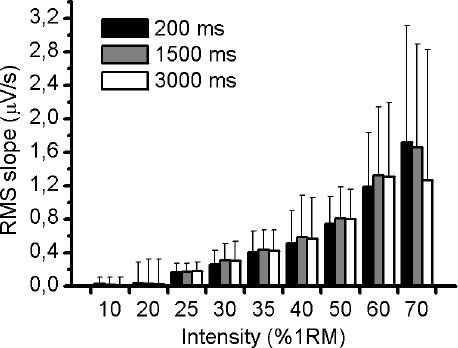
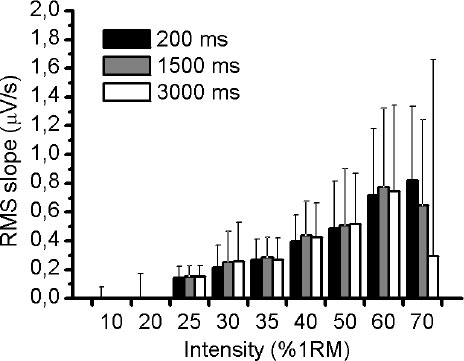
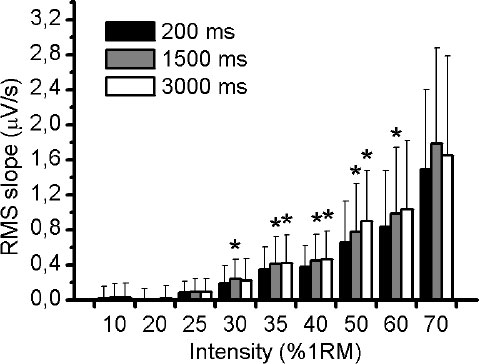
Fig. (1A) illustrates an example of an EMG response of VL muscle during 50% of 1RM and the three different RMS window length analysed (Fig. 1B-D). Using the methodology described above, the slope of RMS was calculated for VM, VL and RF muscles during the incremental test. There was no significant difference (p> 0.05) in RMS slope between the three different RMS window length analyses for VM and VL muscles (Figs. 2 and 3, respectively). For RF muscle, the RMS slope was significantly higher for window length of 1500ms compared to 200ms at 30%, 35%, 40%, 50% and 60% of 1RM (p < 0.05; Fig. 4). The RMS slope was also higher for a window length of 3000ms compared to 200ms at 35%, 40% and 50% of 1RM (p < 0.05). For the other intensities, no significant difference was observed between these RMS analyses. Fig. (5) shows an example of a RMS slope response with a sampling period of 1500 ms in one subject.
The RMS slope demonstrated high reliability among the RMS analyses for VM (ICC = 0.95), VL (ICC = 0.95) and RF (ICC = 0.94) muscles. Table 1 verified the ICC (95% IC) between the RMS window length analyses at all intensities of exercise.
The pattern of the RMS slope response of quadriceps muscle permitted us to detect a threshold on all RMS analyses, which we called an EMGth. Its mean intensity for a window length of 200ms was 29.3 ± 6.7% of 1RM, for window length of 1500ms was 29.4 ± 7.7% of 1RM and for 3000ms was 27.8 ± 7.6% of 1RM. No significant difference existed between mean values obtained in all analyses (p> 0.05). The mean ± DP of the lactate threshold was 28.0 ± 3.7% of 1RM. There was no significant different between the lactate threshold and the EMGth for the different window length analyses (p> 0.05). The Bland and Altman plots confirmed the good agreement between them (Fig. 6). The bias ± 95% limits of agreement for lactate threshold versus EMGth in 200ms, lactate threshold versus EMGth in 1500ms and lactate threshold versus EMGth in 3000ms were -1.4 ± 13.6, -1.4 ± 15.6 and 0.2 ± 14.2% of 1RM, respectively (Table 2).
4. DISCUSSION
The present study reveals that different window lengths for RMS analyses of the quadriceps muscles result in similar RMS slope during incremental resistance exercise, despite some differences in RF muscle. The RMS slope shows high reliability between the RMS smoothing window lengths analyses for the evaluated muscles. Moreover, it was possible to identify a threshold on the RMS slope calculated at the three different window lengths with no differences between them as well as good agreement with lactate threshold.
Previous researches demonstrated a high variability of the RMS signal during dynamic contractions1,4that could be largely reduced with an adequate smoothing process [7, 9]. During dynamic contractions, a classical study [5] established that the variance errors in the EMG amplitude estimate are diminished with a long smoothing window, however, bias errors in tracking the signal of interest are diminished with a short smoothing window. Taking into account the variability of the EMG signal during dynamic contractions, the RMS value in the three different window lengths was plotted in the time domain and used to identify the linear slope. After that, these slopes were used to identify the fatigue threshold. The methodology was chosen based on a classical study [24] in which they verified the greater the power loading imposed during tests, the greater the corresponding increase in the integrated EMG slope.
Although RMS values are not reliable during dynamic contractions [1, 25] these studies suggested that the RMS slope at different intensities of exercise could detect the long-term changes in the EMG while remaining insensitive to the short-term changes caused by dynamic factors. In addition, two of the three evaluated muscles did not show differences in RMS slope between the smoothing window lengths, indicating that the window lengths in these muscles did not affect the RMS slope during resistance exercise. The RF muscle, on the other hand, presented variations between the window lengths that could be explained by geometrical factors such as its bi-articular structure, which could lead to a greater non-stationary signal, resulting in high variability [1, 4]. Nevertheless, there was high reliability for RMS slope calculated at different window lengths in all muscles, allowing the use of other smoothing window lengths to evaluate the behavior of EMG during different bouts of dynamic contractions. For that reason, the smoothed window length can be chosen based on two main factors. The first is using the smoothing window length to represent the duration of concentric and eccentric phases or the total time of one dynamic repetition. This approach is less sensitive to short-term changes but it allows a simple overview of the long-term changes with low variability of the RMS slope. The second factor is using small window lengths to represent the changes of rapid recruitment and de-recruitment of motor units and changes in joint angle during dynamic contractions. This method is more sensitive to short-term changes; however, it illustrates a high variability of the RMS slope. In the same way, other studies [8, 26] have demonstrated that a tradeoff is maintained between error due to estimator variance, which is diminished via a long smoothing window, and error due to estimator bias, which is diminished in the dynamic case with a short smoothing window. Thus, according to the desired situation, the EMG signal may be smoothed using an RMS procedure with different window lengths.
Nonlinear EMG increases similar to those reported in this study have been found in other experiments assessing neuromuscular fatigue during sustained and dynamic muscular contraction [11, 12, 24, 27 – 30]. A classical study from 197831 was the first authors to report that the EMG is an acceptable method for quantifying the total activity of working muscles and for estimating muscle fatigue non-invasively. An increase in EMG activity has been shown to reflect the recruitment of additional motor units and an increase in motor unit rate coding to compensate for the deficit in contractility resulting from impairment of fatigued motor units, as the strength of a muscle contraction increases [31]. Several authors pointed out that the variations in patterns of muscular activity during an exercise could be related to the accumulation of metabolic by-products such as blood lactate [32 – 34].
Similar results between the RMS slope and blood lactate concentration were found in this study. There was no difference between EMGth and lactate threshold and there was a good agreement between the methods. Previous studies confirmed the anaerobic threshold during resistance exercise by the evaluation of glucose and blood lactate concentration, ventilatory parameters and heart rate variability [13 – 16]. The results of the present study showed an EMGth that suggests a correlation between the anaerobic threshold, since the changes in the pattern of neuromuscular activity during maximal incremental resistance testing (RMS slope) appear to be associated with lactate accumulation. To our knowledge, this is the first statement to determine the validity of the EMG method for analyzing the aerobic-anaerobic transition phase during resistance exercise. The initial speculation that using surface EMG could identify the anaerobic threshold in resistance exercise was thus confirmed. The use of RMS slope, rather than the RMS values, was based in classical research [12] in order to provide the smallest possible variation of EMG signal during the bouts of resistance exercise, a limitation that must be taken into account. The RMS slope was a useful method to detect long-term changes in the EMG signal.
There are some limitations in this study, which should be considered. First, the smoothing window lengths used here were chosen in accordance with the duration of each repetition. The lowest window length used was 200ms, however, some studies recommend sample periods even smaller [5, 9] which was not evaluated in this work. Next, we assumed that the quadriceps is represented by the VL, VM, and RF muscles and that they are the primary muscles of leg press exercise, though there are other muscles involved in the exercise. Lastly, it is strongly recommended to assess the behavior of EMG during resistance exercise performed in a constant load at EMGth intensity to verify if the RMS slope is null, which could indicate a stabilization of the EMG signal. It would be a key factor to consider an even stronger relationship with the transition from aerobic to anaerobic metabolism.
CONCLUSION
We concluded that different smoothing window lengths to computed RMS can be used during resistance exercise without significant differences in RMS slope. The behavior of RMS slope during resistance incremental exercise is a simple approach to estimate the EMGth in the quadriceps muscle, which is strongly related to the lactate threshold. The smoothing window lengths don’t have an influence on EMGth intensity. Future research should continue exploring the EMG's potential utility to analyze the possible aerobic to anaerobic transition during resistance exercise as a non-invasive method.
LIST OF ABBREVIATIONS
| VM | = Vastus Medialis |
| VL | = Vastus Lateralis |
| RF | = Rectus Femuralis |
ETHICS APPROVAL AND CONSENT TO PARTICIPATE
This study was approved by our Institutional Research Ethics Committee (#494.2009).
HUMAN AND ANIMAL RIGHTS
No animals were used for studies that are the basis of this research. All human procedures followed were in accordance with the Helsinki Declaration of 1975.
CONSENT FOR PUBLICATION
Informed consent was obtained from the participants of this study.
STANDARDS OF REPORTING
COREQ guidelines were followed.
FUNDING
None.
AVAILABILITY OF DATA AND MATERIALS
The data and supportive information are available within the article.
CONFLICT OF INTEREST
The authors declare no conflict of interest, financial or otherwise.
ACKNOWLEDGEMENTS
Declared none.