All published articles of this journal are available on ScienceDirect.

Comparison and Agreement between Simplified and Three-dimensional Methods for Estimating the Front Crawl Stroke Arm Stroke Efficiency
Authors Info & Affiliations
Abstract
Aims:
To compare and verify the agreement of the arm stroke efficiency (ȠF) results obtained by simplified (ȠFS) and three-dimensional (ȠF 3D) methods.
Background:
Arm stroke efficiency (ȠF) estimates how much of the force applied by the swimmers’ upper limbs contribute to their propulsion. To estimate ȠF, in front crawl stroke, three-dimensional (ȠF3D) and simplified (ȠFS) methods are highlighted.
Objective:
To verify if different methods estimate similar arm stroke efficiency values.
Methods:
Ten male swimmers (age: 21.5 ± 2.6 years; height: 1.78 ± 0.05 m; competitive swimming experience: 12.2 ± 5.0 years) were tested in three 25 m front crawl stroke bouts at low, moderate, and high intensities. The ȠF data were obtained after collecting swimming images with six synchronized cameras and later analyzed in motion reconstruction software.
Results:
The mean results of ȠF, respectively for ȠF3D and ȠFS, were: 34.7±2.1% and 47.4±6.4% at a low; 34.8±2.7% and 42.3±3.3% in moderate; and 33.1±2.6% and 32.4±2.9% at high intensity. Along the intensities, ȠF remained similar with ȠF3D and reduced with ȠFS. ȠF was lower with ȠF3D than with ȠFS at low and moderate intensities (p < 0.05) and similar at maximum intensity (p > 0.05).
Conclusion:
At maximum intensity, the ȠF values agree between the methods. The results obtained by both methods were not fully similar. ȠF3D and ȠFS results agree just at high intensity. The differences between the methods may be due to the different variables used to measure ȠF, stroke rate in the ȠFS and three-dimensional hand velocity in the ȠF3D.
1. INTRODUCTION
One of the goals of biomechanics applied to sport is to quantify a motor pattern and increase motor efficiency in a second moment [1]. In the specific biomechanical analysis of swimming, the arm stroke efficiency (ȠF) allows (i) to estimate how much of the force applied by the swimmers’ upper limbs contribute to their propulsion, (ii) to deeply understand performance, (iii) to create possible technical interventions and (iv) monitor training. Regarding the front crawl stroke, several methods can quantify the ȠF. Among them, the simplified (ȠFS) and the three-dimensional (ȠF3D) methods stand out [2, 3]; Studies with ȠF have been carried out mainly with the front crawl stroke [3-5]. However, considering ȠFS and ȠF3D use different measurements for their calculations, there may be differences in results between the two methods.
In front crawl swimming, the action of the upper limbs has a greater contribution to propulsion than the lower limbs [6], and at high speeds, they provide about 90% of the total propulsive force [7]. In this way, the upper limbs produce more mechanical power for the swimmer's displacement. The final mechanical power (Wf) generated to produce displacement depends on the energy used in the action and how efficient this gesture is [4]. Swimming, being developed in the aquatic environment, makes the swimmer apply force on a fluid to generate propulsion [8] and an amount of this force is dissipated by accelerating water masses in non-propulsive directions [9]. Thus, to assess how much force the swimmer applies in the water takes the swimmer forward, one way can be to calculate ȠF [10].
Regarding the methods, the ȠFS considers the swimmer's speed, the shoulder-hand distance in the final phase of the pull, and the average stroke rate. It is easier to apply as it does not need advanced technology to be used [2]. This model assumes that the tangential hand velocity is representative of the hand velocity [2]. The ȠF3D, on the other hand, considers the ratio between the mean velocity of the center of mass (vCOM) and the three-dimensional mean velocity of the hands in the underwater phase (3Duhand) [3]. This model requires image acquisition and processing for three-dimensional analysis, which makes its application difficult. In a previous study [3], ȠFS and ȠF3D were compared and verified the agreement along a 200 m front crawl test. Although differences between ȠFS and ȠF3D were not found, the results indicated that the difference between the two methods increased the higher the efficiency values [3].
As both models (ȠFS and ȠF3D) seek to quantify ȠF but using different variables, it is questioned whether there are differences and how is the agreement between the ȠF measurements of both under different swimming intensities. Considering the previous study [3], we hypothesized that the ȠF obtained by both methods (ȠFS and ȠF3D) are similar and agree along different swimming intensities. Furthermore, this study can help choose which methodology to use in future tests that identify ȠF. Thus, the present study aimed to compare and verify the agreement of the ȠF results obtained by ȠFS and ȠF3D methods.
2. MATERIALS AND METHODS
2.1. Participants and Ethical Issues
Ten male swimmers participated in this study (age: 21.5 ± 2.6 years, height: 1.78 ± 0.05 m, upper-arm span: 1.86 ± 0.06 m, body mass: 72.2 ± 5.6 kg, and competitive swimming experience: 12.2 ± 5.0 years). Before data collection, all procedures, risks, discomforts, and benefits involved in the study were explained. Each swimmer signed a written consent form. In accordance with the Declaration of Helsinki, the local Research Ethics Committee approved this study (approval number: 2.672.555).
2.2. Protocols
Before the swimming test, anthropometric measurements were obtained, and nineteen body markers (≈ 2 cm diameter) were painted on the swimmers’ bodies for three-dimensional reconstruction of the front crawl stroke [11, 12] and calculating the centre of mass location. For warm-up and familiarization with the 25 m pool where the test took place, all swimmers had fifteen minutes to perform a warm-up of their own choice. According to the test procedure, each participant performed three repetitions of 25 m in front crawl stroke, each with different intensity: low, moderate, and high. Swimmers blocked breathing along the central 10 m of the course (where the images were recorded) to prevent changes in kinematics due to discontinuity from breathing lateral movements. The three intensities were as follows: low as that performed during warm-up, moderate as that performed in a 400 m freestyle event, and high as that performed in a 50 m freestyle event. The order of intensities was random for each participant, who were informed of the intensity at which they would swim immediately before their turn. Swimmers had 3 minutes of rest between each 25 m test.
2.3. Obtaining, Processing, and Analyzing Images
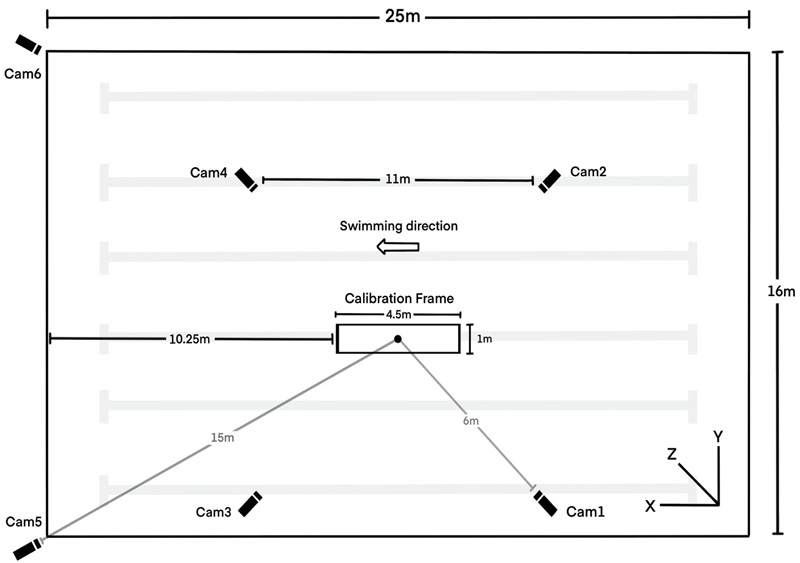
The tests were recorded by six fixed and synchronized video cameras (SONY HDR-CX220, Tokyo, Japan) operating at 60 Hz. Four were positioned below and two above the water. A complete front crawl stroke cycle (the same on the six cameras) was cut from each video (Sony Vegas Pro 15.0 software) when the swimmer's entire body passed through the pre-calibrated space. The calibration volume used had 4.5 m long (x-axis = horizontal), 1.5 m high (y-axis = vertical) and 1.0 m wide (z-axis = mediolateral) and was positioned half above and half below the water, with axis x - corresponding to the swimming direction. Twenty-four specific markers were placed in the calibration volume, and a fixed marker in the pool was digitized to control the calibrated space [13]. Fig. (1) shows the setup.
2.4. Image Processing
The anatomical and control markers were manually digitized using Ariel Performance Analysis System (APAS) software, which incorporates direct linear transformation (DLT), reconstructing the swimmer's images in 3D coordinates. The location of the body's center of mass was identified in the APAS software with the previously adapted Zatsiorsky’s model [14]. The accuracy of the digitalization and calibration procedures was 7.1 mm, 0.8 mm, and 5.3 mm, respectively, for the x, y, and z axes. Data were smoothed with a 4 Hz Butterworth digital filter.
2.5. Calculation of Variables
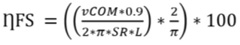
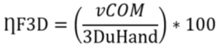
In this study, ȠF were calculated with the two models (ȠFS and ȠF3D), using, respectively, Equations 1 and 2:
 |
(1) |
 |
(2) |
Where ȠFS is the ȠF calculated with the simplified method, vCOM is the speed of the swimmer's center of mass (in this study, vCOM was used as representative of the swimmer’s body velocity), SR is the stroke rate, and L is the distance between the shoulder and the center of the hand when it is located immediately below the shoulder, between the pull and push phases (in this study L was assumed as 0.5 m) [2]. ȠF, in ȠFS, was calculated considering the arm as a rigid segment of length L, rotating at a constant angular velocity over the shoulder. The ȠF was calculated over half a cycle, only for the underwater phase. In this way, ȠF essentially depends on the relationship between vCOM and SR, which are the only variables parameters in the equation. Also, it was assumed that the contribution of upper limbs to swimming velocity was 90% (0.9 in Equation 1). ȠF3D is the ȠF calculated with the three-dimensional method, and 3DuHand is the three-dimensional underwater hand velocity [3].
The SR was determined by the inverse of the stroke cycle duration (SR = 1/cycle duration). In addition, the displacement of the centre of mass (as stroke length - SL) was determined as a function of the time of the stroke cycle. The vCOM was calculated by the quotient between the horizontal displacement of the centre of mass and the time to complete one stroke cycle. 3DuHand was calculated as the sum´s average of the instantaneous 3D velocity of the left and right hand during the underwater phases.
2.6. Statistical Analysis
Data normality was tested using the Shapiro-Wilk test. Afterward, means, standard deviations and limits of the mean confidence intervals were calculated for all variables. For the comparison of ȠF between the two models and the three intensities, factorial ANOVA was applied in a 2 X 3 model, verifying the interaction between the factors. Significant interactions were analyzed with repeated ANOVA and dependent t-tests. Repeated measures ANOVA was applied to compare SR, SL, vCOM, and 3DuHand between intensities. In both cases, sphericity was verified with the Mauchly test, and Bonferroni tests were applied a posteriori.
At each intensity, the effect size of the model for obtaining ȠF was verified with Cohen's d. The effect sizes of the intensities on ȠF in each model and the intensities on SR, SL, vCOM, and 3DuHand, were verified with eta2 statistics. Cohen's d statistic was categorized as: 0 - 0.19 trivial, 0.2 - 0.59 small, 0.6 - 1.19 moderate, 1.2 - 1.99 large, 2.0 - 3.99 too big and >4.0 perfect. Eta2 was categorized as: small: ≤ 0.02, medium: > 0.02 and ≤ 0.08 or large: > 0.08 [15]. The % (Δ%) between the intensities for SR, SL, vCOM and 3DuHand were calculated.
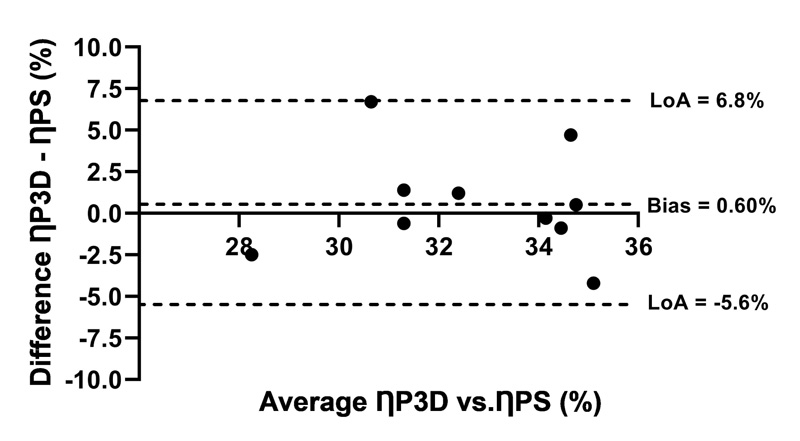
The agreement between the methods was verified by the Bland-Altman graphic analysis, but the graph was only constructed for the intensity whose mean difference between ȠFS and ȠF3D was like zero. Thus, Student's t-test for one sample and simple linear regression were used in the Bland-Altman analysis, together with calculating the limits of agreement (LoA) and bias. Calculations were performed using SPSS, v.20.0 and GraphPad Prisma 8.0 software. Alpha value was established at 0.05.
3. RESULTS
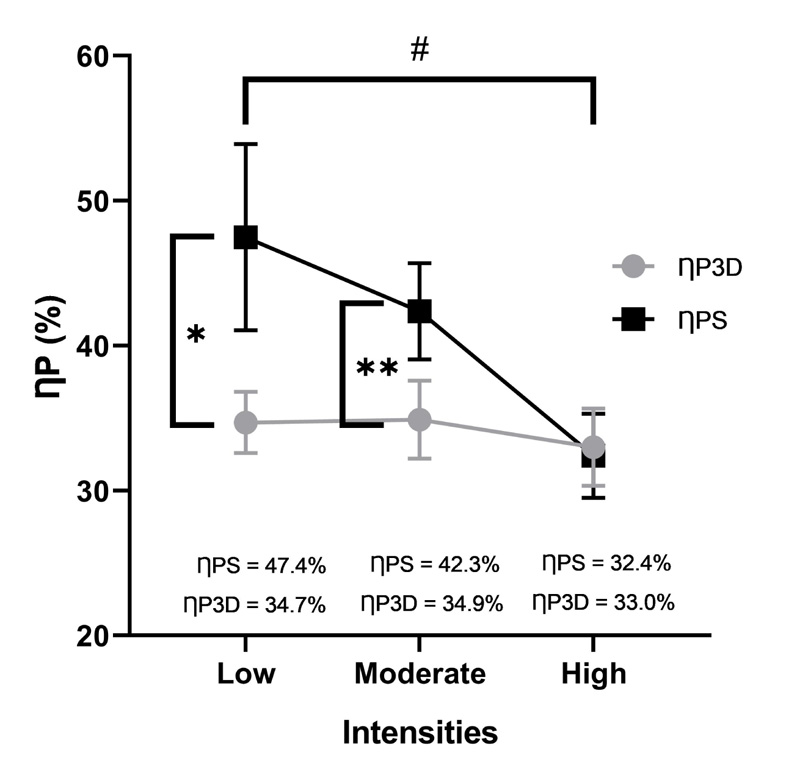
Fig. (2) presents the results of ȠF in response to swimming intensities for ȠFS and ȠF3D. There was a statistical effect of intensity (p < 0.001), of model (p < 0.001) and statistical interaction between intensity and model (p < 0.001). Thus, splits were performed considering intensity and model. ȠF3D and ȠFS presented eta2 of 0.84 over ȠF. The intensities presented eta2 of, respectively, for ȠF3D and ȠFS, 0.16 and 0.92 over ȠF. In the effect size analysis of the models, within each intensity, Cohen's d was, respectively, for low, moderate, and maximum intensities: 2.6; 2.4 and 0.25. Confidence interval limits for ȠF3D were, respectively, for low, moderate, and high intensities, 33.1 to 36.2%, 32.9 to 36.8%, and 31.0 to 34.9%. As for ȠFS, the limits of the confidence intervals were, respectively, for low, moderate, and high intensities, 42.8 to 52.0, 40.0 to 44.7, and 30.3 to 34.4%.
In low and moderate intensities, the mean differences between the ȠF obtained from the two models (ȠFS and ȠF3D) were different from zero (p < 0.05), Agreement analysis was applied only at a high intensity (Fig. 3). Thus, at low and moderate intensities, there was no agreement between the ȠF values obtained from the two models (ȠF3D and ȠFS). At high intensity, the bias between the methods was 0.6% (p > 0.05 vs. zero), and the limits of agreement intervals (LoA) were -5.6 and 6.8%. The linear regression between ȠF mean and the difference was insignificant (p > 0.05).
Table 1 presents the SR, SL, vCOM, and 3DuHand results for the three swimming intensities. The intensity caused a statistically increased SR, vCOM and 3DuHand, with a concomitant reduction in SL. The variables differed in the three intensities, and the effect sizes were between 0.84 and 0.96. SR, vCOM and 3DuHand increased, and the highest Δ% was found for the SR. SL has decreased along the intensities.
| - | Low Intensity | Moderate Intensity | High Intensity | p-value eta2 |
Δ% Low to Moderate |
Δ% Moderate to High |
| SR (cycle∙min-1) |
28.2 ± 4.6* 24.1 to 31.5 |
38.0 ± 3.2* 35.7 to 40.3 |
59.6 ± 5.8* 55.4 to 63.7 |
< 0.001 0.95 |
37.4 ± 22.8 21.5 to 53.3 |
57.2 ± 15.4 46.1 to 68.2 |
| SL (m) |
2.6 ± 0.33* 2.4 to 2.9 |
2.3 ± 0.18* 2.2 to 2.4 |
1.8 ± 0.16* 1.6 to 1.9 |
< 0.001 0.84 |
-11.0 ± 10.0 -18.1 to -3.8 |
-23.3 ± 6.6 -28.1 to -18.6 |
| vCOM (m∙s-1) |
1.21 ± 0.09* 1.15 to 1.28 |
1.48 ± 0.05* 1.44 to 1.52 |
1.77 ± .06* 1.72 to 1.82 |
0.001 0.96 |
22.3 ± 8.9 15.9 to 28.7 |
19.6 ± 3.2 17.3 to 22.0 |
| 3DuHand (m∙s-1) | 1.75 ± 0.09* 1.76 to 1.79 |
2.13 ± 0.14* 2.03 to 2.24 |
2.68 ± 0.15* 2.57 to 2.79 |
< 0.001 0.93 |
21.6 ± 6.7 16.7 to 26.4 |
26.1 ± 12.0 17.4 to 24.7 |
Abbreviationss: SR: stroke rate; SL: stroke length; vCOM: mean velocity of the body center of mass; 3DuHand: mean velocity of the hands in the underwater phase
4. DISCUSSION
Considering the possibilities of estimating ȠF in the front crawl stroke, this study compared and verified the agreement between the simplified (ȠFS) and three-dimensional (ȠF3D) methods. In summary, the main results were: (i) ȠF was higher at low and moderate intensities when obtained by ȠFS compared to ȠF3D; (ii) at high intensity, ȠF was similar between the methods; (iii) ȠF values agreed only at high intensity; (iv) as the intensity increased, ȠF obtained by ȠFS reduced and by ȠF3D remained constant. It is essential to consider the swimming speed at which ȠF was identified and the methods used to identify the ȠF values to compare the ȠF results of the present study with previous results [11].
The results obtained with ȠFS in the present study (from 47.8 ± 6.2 to 32.4 ± 8%), at swimming velocities ranging from 1.21 ± 0.09 to 1.77 ± 0.06 m∙s-1, were similar to those reported in previous studies with the same calculation method: 38.6 ± 1.1% at mean swimming speed of 1.52 ± 0.09 m·s−1 for 11 male swimmers in a 200 m front crawl test [11]; 38.0 ± 6.0% in 27 male swimmers in the front crawl at 1.32 m·s−1 and 36.0 ± 7% in 9 male swimmers in the front crawl at 0.95 ± 0.04 m·s−1 [16]. With the ȠF3D, in the present study, as ȠF did not change along the intensities, the overall mean was 34.2 ± 2.5% for the same swimming speeds already reported. These results were like those reported previously: 31 ± 6% in 11 swimmers with physical impairments at 0.90 ± 0.13 m·s−1 [17]. However, the present ȠF values were lower than 40 to 43% for swimming speed from 1.33 to 1.57 m·s−1 [3].
It is necessary to analyze the components of the equations that calculate ȠF and the differences found in the present study between the results of both methods. In the ȠFS model, the only variables in the equation are vCOM and SR, whereas L (distance between hand and shoulder at the intermediate moment of the propulsive phase of the stroke) was kept constant at 0.5 m [2], and the contribution of the upper limbs to the final velocity was set at 90% [7]. Thus, the values of ȠF in this model varied as a function of the increment of vCOM and SR. The Δ% for vCOM and SR (Table 1) were positive and approximately between 19 and 22% for vCOM and between 34 and 57% for SR. On the other hand, in the ȠF3D model, vCOM and 3DuHand are the only input variables and presented similar Δ%. For 3DuHand, the Δ% ranged between 21 and 26%, like vCOM's Δ%. It is noteworthy that vCOM was used to represent the swimming velocity, and the same values were used in both models.
In the ȠFS model, therefore, the reduction in ȠF is due to increased SR for the increment of vCOM along the proposed intensities. Otherwise, the maintenance of ȠF in the ȠF3D model is possibly due to the similar increments of vCOM and 3DuHand. These results are clearer when verifying the intensity effect size on the values of ȠF: eta2 of 0.92 in ȠFS and 0.16 in ȠF3D. Thus, it is possible to state that about 92% of the variance of ȠF with ȠFS was due to intensities and only 16% with ȠF3D. Together, the models explained about 84% (eta2 = 0.84) of the ȠF’s variance. At low and moderate intensities, the differences between the models were different from zero; in addition to being different values, ȠF obtained from both models did not agree. An agreement was identified at high intensity, with all data within the limits of agreement intervals and a bias of 0.6% (being statistically like zero) without increasing or decreasing bias behaviors associated with the mean between the ȠF data obtained from both models.
CONCLUSION
The results found in this study raise an important question: the ȠFS method indicated a reduction in ȠF between the intensities, possibly due to the increase in SR. This ȠF result may be underestimated, as swimmers tend to increase the SR by increasing the hand speed in the recovery phase. The tangential hand velocity may need deeper analysis to indicate the hand velocity during the arm stroke. As the swimming speed increases, a reduction in ȠF is expected [11], which did not occur with the ȠF3D model. Associated with ȠF analyses, the analysis of global kinematic variables, such as SR and SL, can help to understand the behavior of ȠF. SL, as expected, reduced with increasing intensities, a behavior already well described [18, 19]. However, the ȠF analysis considers the effect of swimming speed and just using SL as an efficiency indicator does not allow more global analysis of the phenomenon.
On the other hand, higher values of ȠF found in low and moderate intensities with ȠFS may be due to this model considering the entire stroke cycle, not just the propulsive phases. Thus, the main difference between the models may be related to the use of the speed of the hands in the submerged phases by ȠF3D. However, due to technological limitations concerning the analysis of propulsion in swimming, so far, it cannot be established whether one method is overestimating ȠF values or whether another method is underestimating the same values. In this way, our hypothesis was partially confirmed, as only at high intensity were the ȠF values obtained from both methods similar and agreed upon. So, the methods are not fully similar and in agreement.
For the analysis of the technical evolution of a swimmer, from the ȠF, at maximum intensity, the results of the present study allow us to support that both methods, ȠFS and ȠF3D, are adequate. However, at different intensities, more studies are needed. It is suggested, in future studies, complementary analyzes to ȠF, such as identification of the coordination model, active drag and energy cost, in an integrated way. In addition, it would be necessary to analyze swimmers of different levels (as youth, adults, master, beginners, recreational, high-level, sprinters, middle and long distance, men, and women) to verify whether ȠF is dependent on such characteristics. In addition, identifying the contribution of leg movements to ȠF would help to understand more deeply the stroke mechanics.
LIST OF ABBREVIATIONS
| APAS | = Ariel Performance Analysis System |
| DLT | = Direct Linear Transformation |
ETHICS APPROVAL AND CONSENT TO PARTICIPATE
The study was approved by the Ethics Committee of Universidade Federal do Rio Grande do Sul (2.672.555).
HUMAN AND ANIMAL RIGHTS
No animals were used for studies that are the basis of this research. All the humans used as per guidelines of the Helsinki Declaration of 1975.
CONSENT FOR PUBLICATION
Written informed consent was obtained from all individual participants.
STANDARDS OF REPORTING
STROBE guidelines were followed.
AVAILABILITY OF DATA AND MATERIALS
The data supporting the findings of the article is available in Researchgate at https://www.researchgate.net/publication/ 355471828_DATA_Comparison_and_agreement_between_simplified_and_three-dimensional_methods_for_estimating _the_front_crawl_stroke_arm_stroke_efficiency
FUNDING
The study is part of a Master's project, and the first author was funded by the CAPES, Brazil, grant code 001.
CONFLICT OF INTEREST
The authors declare no conflict of interest, financial or Otherwise
ACKNOWLEDGEMENTS
We thank swimmers, coaches, and all involved in this study.