
RESEARCH ARTICLE
Using Wavelet Transform for Speed Fluctuation Analysis During Manikin Carry with Fins
Susana Soares1, 2, *, A. Toubekis3, L.M. Machado1, 2, J.P Vilas-Boas1, 2, R.J. Fernandes1, 2, J.A. Abraldes1, 4
Article Information

Identifiers and Pagination:
Year: 2017Volume: 10
Issue: Suppl-2, M8
First Page: 272
Last Page: 278
Publisher ID: TOSSJ-10-272
DOI: 10.2174/1875399X01710010272
Article History:
Received Date: 19/07/2016Revision Received Date: 28/07/2017
Acceptance Date: 14/09/2017
Electronic publication date: 29/12/2017
Collection year: 2017

open-access license: This is an open access article distributed under the terms of the Creative Commons Attribution 4.0 International Public License (CC-BY 4.0), a copy of which is available at: https://creativecommons.org/licenses/by/4.0/legalcode. This license permits unrestricted use, distribution, and reproduction in any medium, provided the original author and source are credited.
Abstract
Background
Wavelet analysis has been used to locate speed variation changes in swimmers, but this elaborated technique was not so far tested in lifesavers carrying a manikin and using one upper limb and fins for propulsion.
Objective:
Our purpose was to examine the feasibility of using the wavelet analysis to locate time-points of speed variation changes in a manikin carry lifesaving race using stiff and fiber fins.
Method:
Fourteen male lifesavers with a mean age of 20.79±4.93 years performed two 25 m all-out manikin carry swimming races using one upper limb and stiff or fiber fins for propulsion. Speed was recorded with a speedometer and its variation was analysed using a wavelet transform analysis. Video recordings were used to measure stroke rate and stroke length within each race.
Results:
Wavelet analysis detected, for some lifesavers, one (stiff: 10.50±1.29 vs. fiber: 9.75±0.50 s; p>0.05) and, for other lifesavers, two time-points (stiff: 6.75±0.96 and 11.50±1.29; fiber: 7.00±1.41 and 12.00±1.83 s; p>0.05) of speed variation changes. Mean speed was no different with fin types (stiff: 1.38±0.06 vs. fiber: 1.42±0.09 m∙s-1; p>0.05), as well as average, maximum and minimum speed. Stroke rate, stroke length and stroke index did not change within each race.
Conclusion:
Wavelet analysis was effective in detecting one and two time-points of speed variation changes within a short duration manikin carry race independently of the type of fins used. Fiber and stiff fins showed similar biomechanical and speed variations within race changes.
1. INTRODUCTION
Competitive lifesaving is a unique mode of aquatic exercise, demanding propulsive actions by the lower limbs wearing fins and one upper limb for the completion of a race [1]. In this sport, the other upper limb is holding the manikin that a lifesaver must carry during the race, imposing one more constrain to his/her movements. Developing and maintaining a high average speed while keeping low speed variability is critical for the achievement of high performance during swimming and possibly during lifesaving competition [1-4]. In this respect, continuous measurement of speed and detailed recording of its variation should be regularly applied for testing competitive lifesavers.
Previous studies have used a portable speedometer to record speed variations during sprint swimming [5, 6], with the same methodology being used to compare speed changes during manikin carry with different kind of fins in competitive lifesavers [7, 8]. Speed variation and fatigue index calculation are useful tools for comparison between different kinds of fins and provide helpful information for the fitness assessment of lifesavers. Speed variation characteristics can be further analysed, and additional useful information can be obtained, using the advantage offered by the high sampling frequency of data collection when using a speedometer. This would require an elaborated mathematic treatment to get valid results regarding exact time-points of a race when distinct speed variation changes occur. Such information would be useful for the coach, helping in designing a training plan focused in delaying the time when speed drop or speed variation changes occur, aiming increasing the mean speed of the lifesaver.
An approach requiring the continuous wavelet analysis of the signal produced by the speedometer has been suggested for application during sprint swimming [9] and has been effectively used to identify exact time-points when distinct speed variation changes occur in a 50 m swimming race [6]. Whether this can be seen during manikin carry in a short duration all-out effort is not known. Such an effort possibly presents different speed variation characteristics compared to those presented in front crawl swimming. Furthermore, different kinds of fins may imply different speed variations and it would be helpful to suggest whether one of these may present superior speed variation characteristics over the other.
Therefore, the main purpose of the present study was to examine the feasibility of applying the wavelet analysis to locate time-points of speed variation changes in a short duration all-out manikin carry race. A secondary purpose was to examine likely differences in speed variation changes between two different kinds of fins that are commonly used in competitive lifesaving.
2. MATERIALS AND METHODS
2.1. Participants
Fourteen male experienced lifesavers with a mean age, body mass, height and body mass index of 20.79±4.93 years, 73.49±12.88 kg, 175.73±6.59 cm and 23.67±2.98 kg.m-2 (respectively) participated in the study. All lifesavers were volunteers and signed an informed consent form before participation. All the procedures were approved by the local ethics committee in accordance with the Helsinki Declaration.
2.2. Experimental Procedure and Materials
Each lifesaver performed two 25 m all-out manikin carry swimming races starting with a push from the wall. The races were applied with a 30 min recovery, in a random order, one using stiff and the other fiber fins. During the race the subjects were allowed to perform lower limbs actions and use one upper limb for propulsion while the other upper limb was carrying the manikin.
The manikin (Swedish model) was a PITET closed plastic type, with 1m height and a land weight of 80 kg when totally filled of water. It were used Cressi-Sub stiff fins (with 59 cm length and 20 cm width) and Special Films, model Sebak Saber 140 Hard M fibre fins (with 65 cm length and 22 cm width, rectangular on its tail, with an open shoe part on the heel and fixed to the lifeguard foot by a brace). All tests were performed in a short course indoor swimming pool with a mean depth of 2 m and water temperature was kept at 27.5ºC.
A cable speedometer [6, 10] was connected to a central point in the manikin’s chest, allowing the measurement of intracyclic velocity variations over time [v(t)]. A brake engine allows the full system inertia to be insignificant, keeping the cable always stretched. All efforts were video recorded using a SONY Handycam camera (HDR-CX160E) placed on a trolley and moving on the pool side parallel to the swimmers movement. The images synchronization with speed recordings from the speedometer was performed by flashing a LED at the starting signal [6, 10].
2.3. Data Treatment and Analysis
Fig. (1) schema represents the main calculations performed. During the data analysis, the first 3 s of the v(t) curves of each swimmer were removed, minimizing the effect of the initial impulse [6]. From stored data, the maximum (vmax), mean (vmean) and minimum (vmin) velocities, coefficient of variation (CV) of the velocity (equation 1) and the fatigue index (FI) (equation 2) were calculated as follows:
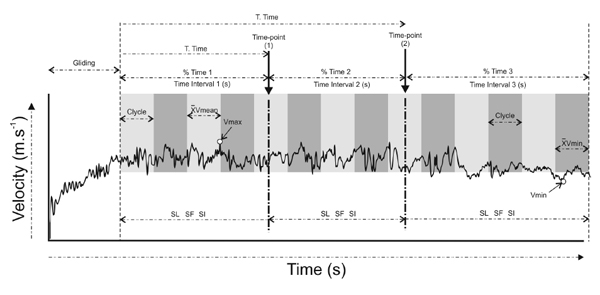 |
Fig. (1). Representative schema of speed variation during a 25m manikin carry race. Each upper limb cycle is representing by different shaded areas. The exact points of speed variation change are representing by the 2nd and 3rd vertical lines (threshold 1 and threshold 2), and the first and last vertical lines represent the starting and ending time-points of data analysis. |
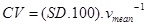 |
(equation 1) |
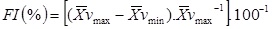 |
(equation 2) |
Where SD is the vmean standard deviation,
 of horizontal speed is the vmean of the upper limb cycles were the vmax was found and
 of horizontal speed is the vmean of the upper limb cycles were the vmin was found Fig. (1).
A MatLab (9.0 version) routine, described in detail elsewhere [9], was used to analyse the instantaneous velocity curves including a continuous wavelet analysis of the signal. Through this procedure it was possible to locate the exact time points when spectral content changes occurred, with these points separating regions of the v(t) curve with distinct spectral content properties. After locating these specific time points, the mean speed (Vmean) and the biomechanical parameters stroke rate (SR), stroke length (SL) and stroke index (SI) within each region were compared Fig. (1). SR was calculated by the time taken to complete three upper limb cycles using the video recordings. SL was calculated as the quotient of Vmean and SR, and SI was calculated by the product of Vmean and SL.
2.4. Statistical Analysis
SPSS 19.0 was used in all statistical analysis, with the mean and standard deviation being used to describe variables and the Shapiro-Wilk test applied to test distributions normality. Repeated and independent t-test and repeated One-way ANOVA were applied to compare variables within and between conditions, with level of significance set at 5%.
3. RESULTS
Lifesavers achieved similar vmax, vmean and vmin, as well as FI, when using either stiff and fiber fin types (Table 1).
| Test Conditions | vmax (m.s-1) | vmean (m.s-1) | vmin (m.s-1) | FI (%) |
|---|---|---|---|---|
| Stiff fins | 1.76±0.05 | 1.38±0.06 | 1.04±0.10 | 11.98±3.64 |
| Fiber fins | 1.77±0.05 | 1.42±0.09 | 1.03±0.15 | 13.13±2.10 |
During the 25 m all-out races, using the wavelet analysis, it was possible to detect one time-point of speed variation change (within the 10th s) in nine cases and two time-points of speed variation changes (within the 7th and 12th s) in five cases. These one and two speed variation changes occurred at a similar time-point independently of the type of fins used (Table 2).
| Test Conditions | One Time-point of Change (s) | Two Time-points of Change (s) | |
|---|---|---|---|
| Stiff fins | 10.50±1.29 | 6.75±0.96 | 11.50±1.29 |
| Fiber fins | 9.75±0.50 | 7.00±1.41 | 12.00±1.83 |
Biomechanical parameters evaluated before and after the time-points of speed variation change occurrence for the cases with one time-point and two time-points of speed variation change are presented in Table (3) (1st and 2nd time intervals, and 1st, 2nd and 3rd intervals in the upper and lower panels, respectively).
| Interval | SL (m) | SR (Cycles.s-1) | SI (m2.s-1) | Vmean (m.s-1) | CV (%) | |
|---|---|---|---|---|---|---|
| Stiff | 1st | 1.35±0.14 | 0.99±0.11 | 1.79±0.21 | 1.32±0.06 | 0.10±0.01 |
| 2nd | 1.32±0.20 | 0.96±0.11 | 1.67±0.32 | 1.25±0.06 | 0.10±0.04 | |
| Fiber | 1st | 1.45±0.43 | 0.98±0.24 | 1.96±0.59 | 1.35±0.07 | 0.10±0.01* |
| 2nd | 1.35±0.26 | 1.01±0.17 | 1.82±0.37 | 1.34±0.07 | 0.08±0.01 | |
| 1st | 1.38±0.13 | 1.11±0.07 | 2.09±0.07 | 1.51±0.05** | 0.08±0.02 | |
| Stiff | 2nd | 1.37±0.11 | 1.06±0.07 | 1.98±0.26 | 1.44±0.09 | 0.09±0.02 |
| 3rd | 1.41±0.15 | 1.00±0.67 | 1.96±0.32 | 1.39±0.09 | 0.07±0.03 | |
| 1st | 1.53±0.13 | 0.94±0.14 | 2.17±0.22 | 1.43±0.14** | 0.09±0.03 | |
| Fiber | 2nd | 1.50±0.11 | 0.93±0.04 | 2.11±0.37 | 1.40±0.14 | 0.11±0.02 |
| 3rd | 1.47±0.15 | 0.92±0.08 | 2.01±0.41 | 1.36±0.16 | 0.08±0.02 | |
All variables (with exception of CV) did not differed between the 1st and 2nd interval in one speed variation change cases, but a significant speed decrement was observed in the 3rd compared to the 1st interval in the two-point speed variation changes cases. No comparison to examine differences in SR and SL between different types of fins was applied since some lifesavers presented one time-point of speed variation change in one condition and two time-points of speed variation changes on the other condition and vice-versa.
4. DISCUSSION
The purpose of the present study was to examine the feasibility of using the wavelet analysis technique to detect speed variation changes in short duration all-out manikin carry races. It was found that the wavelet analysis is effective in detecting one and two time-points of speed variation changes in the v(t) curve. In addition, when two different (stiff and fibre) fin types were compared, mean speed and CV where no different and SR, SL and SI stayed unchanged within each race.
The wavelet analysis has previously been applied to detect speed variation changes during a 50 m and 30 s maximum swimming effort [6, 9], being observed one and two time-points of speed variation changes. In the current study, despite the short duration of the 25 m all-out race performed with stiff and fiber fins, the wavelet analysis was effective detecting one time-point and two time-points of speed variation change in nine and five cases, respectively.
Previous studies using a different mathematical approach for data analysis have detected one time-point of speed change within a 25 m sprint swimming race at 5.5 s after the start [4]. This value is close to the current 1st time-point of speed variation change (6-7 s) in cases with two time-points of change. However, the time of one time-point of speed variation change occurrence (~9-10 s) was the double than that that reported in the above-referred study. 10 s is possibly the time required to reach maximum speed (~7 s) plus the time swimmers are able to maintain this speed (i.e. ~2-3 s), as it has been reported after a detailed race analysis with video recordings [11]. Previous studies that tested the same type of manikin carry using stiff fins indicate a speed drop after 11 s of exercise [8].
Eventual differences between the current data with previous findings is possibly justified by the different training status of the lifesavers compared to competitive swimmers, the use of fins comparing to barefoot swimming and/or to the constraint imposed by manikin carrying. It is plausible that each participant organises his upper and lower limbs movements according to imposed constrains [12], existing evident differences between front crawl swimming and manikin carry one-upper limb swimming with fins, causing unlike speed variations within and between upper-limb cycles. It is interesting to note that Gourgoulis and colaborators observed an increased intracyclic horizontal speed variation when swimming 25 m carrying a load compared to unimpeded front crawl [13]. The manikin carrying, the use of only one upper limb for propulsion and the use of fins are possibly interacting as constrains, causing the differences in the time-point of speed variation changes comparing to the literature.
In addition, regarding to previous studies, it seems that the implemented wavelet analysis is more sensitive and provides not only one but, in some cases, two time-points of speed variation. This information advances the knowledge for the science of swimming and aquatic activities, advising coaches in competitive lifesaving to emphasise both short and long duration sprint bouts during training to overcome time-points of speed variation.
Comparing the two types of fins studied, no differences were observed in vmean, vmax and vmin, as well as FI. In the literature, fiber and stiff fins presented similar instantaneous (2 s) initial speed, but fiber fins showed higher values in the middle of a 25 m all-out manikin carry race [8]. As in this latter study there are some contradictory results - no average speed differences between fins were detected in the first and second half of the race - it is evident the necessity of a more detailed comparison between types of fins. This was accomplished in the current study by implementing the elaborated wavelet analysis, being realised that lifesavers presented a different v(t) profile with each fin type.
In fact, some lifesavers presented one time-point of speed variation change with fiber fins but two time-points of speed variation changes with stiff fins and vice-versa. In this case, any time-point difference in the appearance of speed variation change could not be attributed to the lifesavers fatigue and/or fitness characteristics, but to the fin type characteristics, as the same subjects completed the race with both fin types. It is known that different kinds of fins present changes in buoyancy and surface area, implying diverse energy demands [14]. In addition, although with the wavelet analysis it was possible to detect time-points of speed changes precisely, no difference was observed between fins in the time of appearance of one and two time-points of speed variation change. Interestingly, fiber fins seem to better maintain the speed between intervals (1stvs. 2nd or between 1st 2nd, 3rd intervals) compared to stiff fins.
The general biomechanical parameters SR, SL and SI remained (Statistically speaking) unchanged between the 1st and 2nd or between 1st, 2nd and 3rd intervals in all cases, in partial agreement with previous finding in front crawl swimming [6], as observed also for SR during 15 s of a 30 s one-upper limb swimming sprint [15]. Although the comparison of biomechanical properties between one-upper limb lifesaving swimming and front crawl is not appropriate, the stability of biomechanical parameters may be attributed to similar reasons, particularly to the appropriate adjustment of upper to lower limbs coordination [12] and according to fin type properties. However, it is likely that during a swimming race >15 s duration it will appear a SR decrease [16].
CONCLUSION
Wavelet analysis is appropriate to detect speed variation changes and precisely locate the time-point of alteration. This can be effectively applied within a short duration all-out 25 m race. Within this short duration race, one and two time-points of speed variation change can be observed independently of the fin type. Stiff and fibre fins showed similar speed variation characteristics but the lifesaver’s response using each type may be not similar as hinted by the one versus two time-points of speed variation changes. This indicates that further research should examine the individual characteristics of each lifesaver that better fit with one or the other type of fins.
ETHICS APPROVAL AND CONSENT TO PARTICIPATE
About ethical aspects, the present study was performed with humans but the protocol was not invasive neither diferent from what athlets do in they day-by-day. Because of that, we do not need aproval from ethics commetee.
HUMAN AND ANIMAL RIGHTS
No Animals/Humans were used for studies that are base of this research.
CONSENT FOR PUBLICATION
Not applicable.
CONFLICT OF INTEREST
The authors declare no conflict of interest, financial or otherwise.
ACKNOWLEDGEMENTS
Declared none.